Every leadership decision your company makes, who to hire, who to promote, where to cut, now runs through data whether you’re ready for it or not. The problem usually isn’t a lack of data. It’s that most leaders were never taught what to do with it.
Data-driven skills used to belong to analysts. Not anymore. At a company with 50 to 250 employees, the leader who can’t read a retention chart or ask a vendor the right question about their AI model is making decisions with less information than what’s already sitting in front of them.
Key takeaways
- Data-driven decision making is a core leadership capability now, not a technical specialty. Most organizations still haven’t built the culture to back that up.
- Modern leaders need a working blend of data literacy, analysis, data management, strategic framing, communication, behavioral data fluency, and enough AI literacy to ask a vendor the right questions.
- These skills aren’t reserved for data scientists or IT anymore. CEOs, HR leaders, and people managers all need working fluency.
- Tools like AI and behavioral people analytics platforms, OAD among them, amplify these skills. They don’t replace judgment. They give judgment something to check itself against.
- This is a practical roadmap for HR leaders, founders, and decision makers at mid-sized companies (50 to 250 employees) who want to run on evidence instead of guesswork.
Why Data-Driven Skills Matter in 2026
By 2026, every function is competing on how well it uses data: marketing, finance, operations, and especially HR and people analytics. The volume of data available to any given company keeps climbing, and most organizations still struggle to turn that volume into an actual decision.
Here’s the real gap. In the most recent Data & AI Leadership Executive Benchmark Survey, 98.4% of organizations report increasing their investment in data and AI, but only 32.5% report having actually established a working data and AI culture.
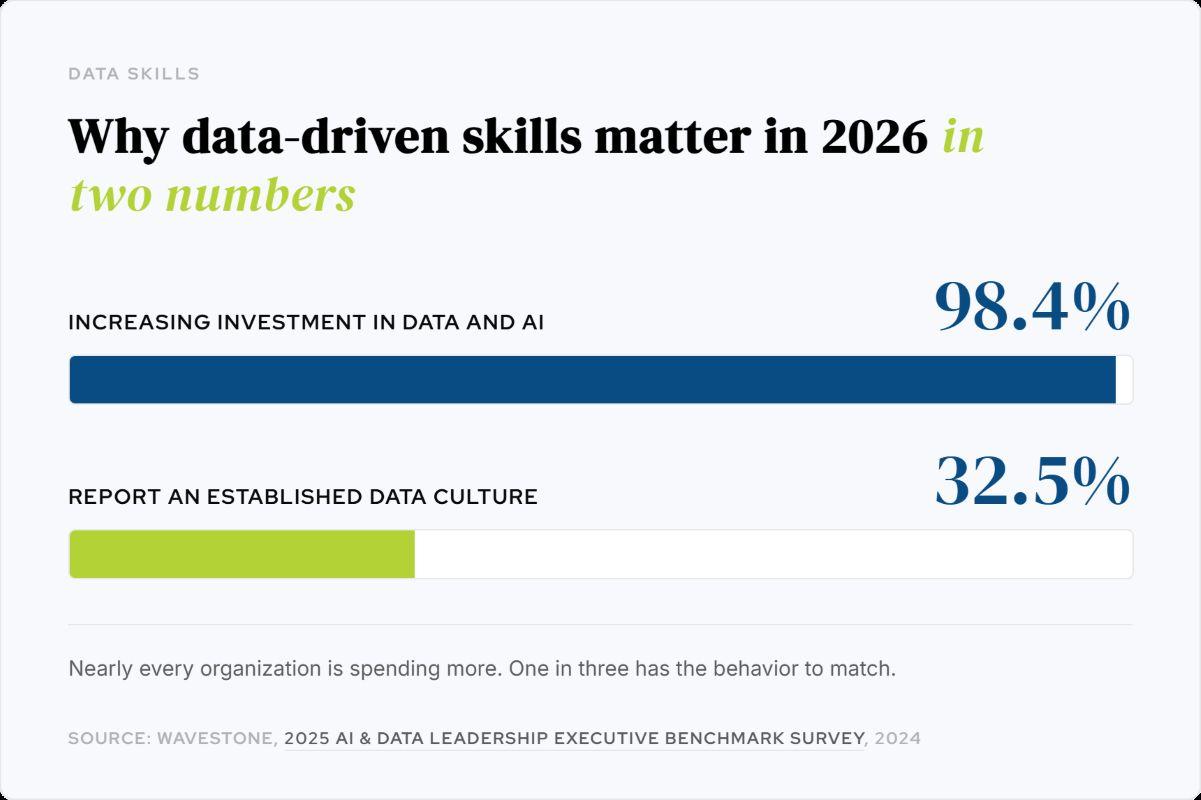
Nearly everyone is spending. Roughly a third have actually changed how they decide. Data-driven decision making increases accuracy and reduces uncertainty, but only if your people have the skills to act on what the data reveals. The spend without the skill is just a more expensive version of guessing.
For a company with 50 to 250 employees, that gap costs more than it does at scale. A larger firm can absorb a mis-hire, a preventable burnout case, a leadership misalignment. A mid-sized one often can’t. The rest of this article is a practical roadmap to the skills that close that gap.
What We Mean by “Data-Driven” in Business
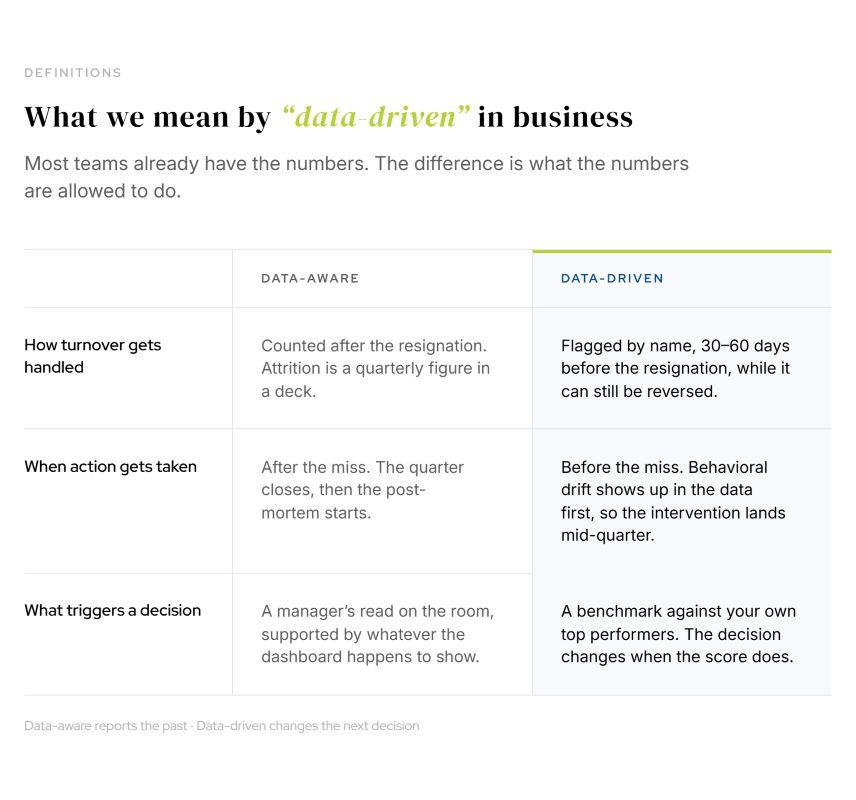
Data-driven decision making uses data, analytics, and measurable evidence to guide business choices tied to specific goals. It isn’t glancing at a quarterly report. It’s letting good data shape strategy, priorities, and resource allocation consistently, not just when something goes wrong.
There’s a real difference between data-aware and data-driven. A data-aware organization checks turnover after the fact. A data-driven one uses retention data, behavioral results, and performance metrics to anticipate the problem and act before it escalates.
Three terms worth keeping straight: data analysis is inspecting and transforming existing data to find something useful in it. Data analytics, sometimes called business analytics, is the broader use of analysis, trends, and predictive models to support strategy. Data management is the set of practices that keep that data collected, stored, secured, and trustworthy in the first place.
Being data-driven doesn’t mean ignoring intuition. It means treating intuition as a hypothesis and testing it against evidence before you commit resources to it.
Core Data Literacy: The Foundation Skill for Everyone
Data literacy is the most fundamental skill in this list: the ability to read, question, interpret, and communicate what a dashboard, chart, or report is actually saying. It belongs to every professional now, not just analysts, and organizations that only build it in one function are leaving most of their leadership team unable to check their own assumptions.
Concretely, that means understanding what a metric like turnover rate or conversion rate is actually measuring, reading a bar or line chart without help, telling a real trend apart from a one-off spike, and spotting an obvious data quality problem before it drives a decision. A working sense of basic statistics prevents the kind of misinterpretation that turns noise into a strategy.
The gap here is real and specific to HR. AIHR’s Future-Ready HR Skills Report found that around 40% of HR professionals don’t feel confident understanding or translating data. That’s a gap a mid-sized company can close without a big budget: short internal training sessions, a standing “data office hours” slot, and access to a simple tool like Google Sheets or a shared dashboard. An HR leader who can segment retention data by team before proposing a policy change will make a sharper call than one reacting to a single company-wide average.
Analytical Thinking and Basic Data Analysis Skills
Tools matter, but without analytical thinking, the ability to ask the right question of the data in front of you, a spreadsheet or a BI platform goes underused. The World Economic Forum’s Future of Jobs Report ranks analytical thinking as the single most important core skill employers look for. The same report puts AI and big data at the top of its list of the fastest-growing skill areas. Analysis is what turns that raw skill into a finding: it lets you pinpoint the actual issue instead of treating the symptom sitting on top of it.
A few capabilities do most of the work for a non-specialist: slicing data by segment (role, team, location), comparing time periods month-over-month or year-over-year, calculating a simple correlation without assuming it proves causation, and building a basic pivot table or aggregation. Using that kind of analysis to identify which roles carry the highest 12-month voluntary turnover, and what those roles have in common, lets you put retention effort where it actually moves the number instead of spreading it evenly across the org chart.
When you hand a question to an analyst, specificity matters. “What’s driving rising attrition among mid-tier engineering roles this year?” gets you something usable. “Send me all the data” doesn’t.
Data Management and Governance: Trustworthy Inputs for Better Decisions
Data management is what keeps data accurate, consistent, secure, and usable across every system that touches it, your HRIS, ATS, CRM, and any assessment platform in the stack. Without it, leaders end up making decisions on conflicting headcount numbers, missing hire dates, duplicated candidate records, and performance data trapped in a silo nobody else can see. Data cleaning, handling missing values, duplicates, and incorrect records, is unglamorous, foundational work that most mid-sized companies underinvest in until it costs them a bad decision.
Good governance doesn’t require a data engineering team. It requires a few non-technical habits done consistently: naming a clear owner for each system, agreeing on standard definitions (what actually counts as “voluntary turnover” in your company), running a simple data quality check on a monthly cadence, and knowing that SQL is the standard language behind most relational databases even if you never write a query yourself.
Tools like OAD are built to plug into an existing data environment rather than replace it, feeding clean, structured behavioral data into whatever reporting and analytics setup you already run. That gives a mid-sized company access to validated people data without building custom infrastructure to house it.
Design teams with data, not gut feel.
Most org-design decisions come down to role fit, leadership style, and team dynamics. OAD reads those signals from a 7-minute behavioral survey, so you can reconfigure roles and teams with evidence instead of guesswork.
Business Context and Strategic Framing: Turning Numbers Into Direction
One of the most underrated data skills is connecting a metric to an actual strategy question. Analytics only optimizes resource allocation and operational efficiency when someone has already tied the metric to an outcome that matters.
That means picking a small set of KPIs and ignoring the rest, not tracking everything because tracking feels like diligence. If the goal is to reduce turnover by 20% in your highest-cost teams, the chain runs: voluntary turnover by team, exit reasons, cost per departure, then the levers that actually move those numbers, leadership development, role redesign, compensation structure. Strategy tells you what to measure. Analytics tells you which lever actually moves it. A leader should be able to explain, in plain language, how a given metric supports growth or reduces risk before asking a team to spend time tracking it.
Human and Behavioral Data Skills: From People Analytics to Better Teams
People analytics, using data about how employees behave, perform, and are likely to perform, is now central to data-driven decision making in HR. Effective data collection here pulls from several sources at once: performance ratings, engagement data, absenteeism records, and validated behavioral assessments.
The skill isn’t running the assessment. It’s knowing what the resulting data actually means: understanding what a behavioral score is telling you, recognizing a real pattern in team dynamics versus a coincidence, and linking behavioral data to an outcome like retention or productivity rather than treating it as a standalone report nobody acts on.
OAD’s Top Performer Profile, seven minutes, results in 24 hours, no credit card, turns a qualitative impression into a quantifiable data point: identifying where leadership potential actually sits, flagging early burnout risk before it becomes attrition, and showing how a new hire’s working style lines up with the team they’re joining. Combined with the HR metrics you already track, that gives hiring, promotion, and succession decisions a second, independent input instead of relying on interview impressions alone.
Design teams with data, not gut feel.
Most org-design decisions come down to role fit, leadership style, and team dynamics. OAD reads those signals from a 7-minute behavioral survey, so you can reconfigure roles and teams with evidence instead of guesswork.
Two things matter as much as the data itself: continuous monitoring, since a one-time snapshot goes stale, and transparency with employees about how behavioral data gets used. Avoid the “scores equal destiny” trap. A behavioral profile describes a working style, not a verdict on someone’s worth.
Communication, Storytelling, and Change Management With Data
Data storytelling is the skill of turning a dense analytics dashboard into a narrative with a clear problem, a key insight, and a recommended action. A good visualization gets you halfway there; the story is what makes an executive, a manager, and a frontline employee all understand the same number in the language they actually think in. Executives want the business outcome and the return. Managers want team-level context they can act on. Employees want clarity and fairness.
Here’s how that plays out as an illustrative example, matched to a real client scenario rather than an invented one. On a 200-person operations organization, layering behavioral benchmarking into hiring and promotion decisions took annual turnover from 34% to 19% alongside a drop in time-to-productivity, tracked and reported the same way you’d report any other operating metric: a before-and-after view, tied to a dollar figure, presented once the pilot had enough data to be credible. That’s the version that gets budget approved. A dashboard nobody can explain in one sentence doesn’t.
Change management closes the loop: anticipate the resistance before it shows up, use data to address the specific concern rather than the general one, pilot the change before rolling it out company-wide, and keep reporting the metric afterward to prove the decision is actually working, not just that it felt right at launch.
Working With AI and Advanced Analytics Without Being a Data Scientist
A decision maker doesn’t need to build a model. They need to understand what AI, predictive analytics, and machine learning can and can’t do, well enough to ask a vendor the right question instead of taking their word for it.
For a mid-sized business, the practical applications are narrow and specific: predictive models that flag turnover risk before it happens, sentiment analysis for early burnout detection, and AI-assisted screening layered with a structured behavioral assessment rather than used alone. Before you buy any of it, ask the vendor three questions: what is the model trained on, has it been independently validated, and does it show adverse impact on any protected class? A tool that can’t answer all three isn’t a data asset. It’s a liability with a dashboard attached.
OAD’s own answer to that last question is on the record, not a promise: EEOC compliant since 2001, zero successful legal challenges in 38 years, and three independent third-party validation cycles, most recently in 2023. That’s also the limit of what any behavioral tool should claim for itself. Behavioral data is one structured input into a decision a human still makes, on hiring, promotion, or performance, never a replacement for making it.
Building Data-Driven Skills Across Your Organization
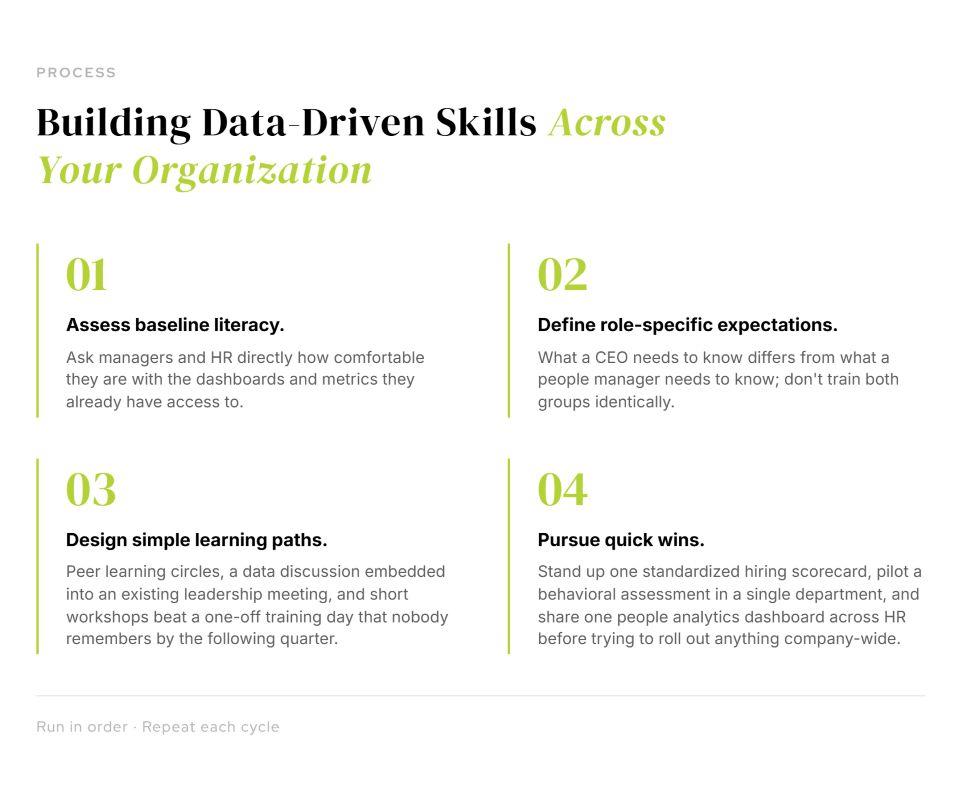
Building this capability across a team doesn’t mean turning everyone into an analyst. It means giving people at every level the specific piece of fluency their role actually needs.
Assess baseline literacy. Ask managers and HR directly how comfortable they are with the dashboards and metrics they already have access to.
Define role-specific expectations. What a CEO needs to know differs from what a people manager needs to know; don’t train both groups identically.
Design simple learning paths. Peer learning circles, a data discussion embedded into an existing leadership meeting, and short workshops beat a one-off training day that nobody remembers by the following quarter.
Pursue quick wins. Stand up one standardized hiring scorecard, pilot a behavioral assessment in a single department, and share one people analytics dashboard across HR before trying to roll out anything company-wide.
The fastest gains come when leaders visibly model data-driven behavior in their own decisions, not just ask for it from everyone else, and give people tools simple enough that using them is actually easier than skipping them. For a mid-sized company without a dedicated analytics team, a platform like OAD is a practical starting point: it delivers usable, structured insight about your people from day one instead of asking you to build the infrastructure first.
Data-Driven Skills in Practice: FAQ
How can a non-technical manager start becoming more data-driven? Start with one or two core dashboards and learn exactly what each metric on them is measuring. Track one people metric, like 90-day turnover, and one business metric, like revenue per employee, consistently over a few quarters. Partner with an HR or analytics colleague for an occasional 30-minute data walkthrough; it builds confidence faster than a formal course. The goal isn’t mastering data science. It’s learning to ask a better question and recognize a pattern that should change your next move.
How do I avoid data overload when making a decision? Get clear on the specific decision you’re actually making, then limit yourself to three to five indicators tied directly to it. Favor a dashboard that shows a trend over time over a wall of one-off charts, and settle in advance which data source is the authoritative one when two disagree. If a metric wouldn’t change an action or a priority, it probably doesn’t belong in the decision at all. Depth on a few numbers beats breadth across dozens.
Where does intuition fit into data-driven decision making? Intuition is distilled experience, and it’s genuinely useful as a hypothesis generator. Data is what validates or corrects the hunch before you commit resources to it. If a leader senses a team is burning out, check the workload data, the engagement numbers, and a behavioral signal before redesigning anyone’s role around a feeling. Data doesn’t replace instinct. It stress-tests it against what’s actually happening.
How long does it take to build strong data-driven skills in a team? Basic literacy and comfort with a simple dashboard improve noticeably within three to six months of focused practice. Deeper capability, connecting data to strategy, telling a compelling story with it, driving change through it, takes 12 to 18 months of intentional use to become second nature. The fastest gains come from leaders modeling the behavior themselves and giving teams simple tools with clear, shared definitions. Start from where the team actually is, not from a perfect training program that never ships.
How can OAD specifically help us become more data-driven about our people decisions? OAD’s Top Performer Profile turns a qualitative impression about a candidate or employee into a quantifiable, comparable data point in seven minutes, with results in 24 hours. HR leaders and managers use that data to inform hiring, promotion, team composition, and early burnout decisions instead of relying on interview impressions alone. It integrates into the HR process you already run, giving a mid-sized company a fast way to introduce real people analytics without standing up a dedicated analytics team to do it.
Start With One Metric You Can Trust
You don’t need a data science team to start making better people decisions. You need one clean, structured input you can actually rely on. See the science behind how that input gets built, or how it applies specifically for HR and people leaders.
Get your free Top Performer Profile: seven minutes, results in 24 hours, no credit card.