Teams don’t fail because they lack talent. They fail because they lack a shared operating system: how decisions get made, how conflict gets handled, how information moves, and whether people feel safe enough to tell the truth before something breaks.
A team dynamics assessment makes that operating system visible. Done well, it gives leaders a practical map: what to protect, what to fix, and what to stop pretending is “just personality.”
Table of Contents
- What is a team dynamics assessment?
- Why team dynamics matter for team performance and team success
- How do you assess team dynamics? A practical step-by-step process
- What to measure in a team dynamics assessment
- Turning results into insights: analysis methods that actually help
- Reporting: what “valuable insights” should look like
- From insights to action: recommendations that improve team dynamics
- Leadership development based on team dynamics findings
- Implementation plan: how to improve team dynamics over time
- Deliverables: what a strong assessment output includes
- Follow-up: next steps and continuous improvement
- Privacy, security, and administration
- FAQ: Team dynamics assessment questions (People Also Ask)
- Conclusion: building a shared language for team performance
What is a team dynamics assessment?
A team dynamics assessment is a structured way to measure how a team functions day to day, not just what it produces. It looks at patterns like communication, trust, cohesion, role clarity, decision-making, accountability, and how the team responds under pressure.
Think of it as diagnosing the system, not blaming individuals.
What is a team dynamics questionnaire?
A team dynamics questionnaire is the most common format for assessment: a survey where team members respond to statements about how the team works (for example: “We can raise concerns without negative consequences” or “Decisions are clear and stick”). Some questionnaires include open-ended prompts so the team can explain what’s driving the scores.
A good questionnaire has three traits:
- It measures behaviors and conditions, not “good vibes.”
- It can be aggregated safely (so results don’t turn into a witch hunt).
- It leads to actions a leader can actually implement.
What a team dynamics assessment measures
Most useful assessments cover these categories:
- Cohesion and trust: Do people feel connected enough to coordinate fast?
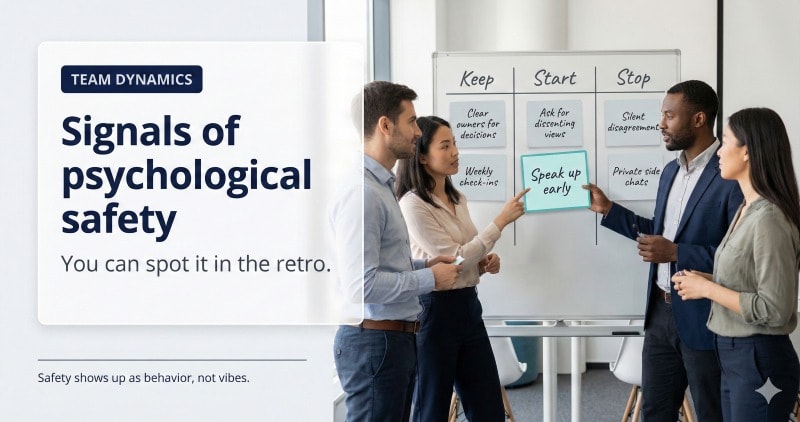
- Psychological safety: Can people speak up, admit mistakes, challenge ideas?
- Communication and feedback: Is information shared early or hidden until it’s late?
- Conflict patterns: Does conflict get resolved or recycled?
- Role clarity and accountability: Do people know what “good” looks like and who owns what?
- Alignment: Do leader priorities match what the team experiences day to day?
Google’s research on effective teams popularized a simple truth: team performance is strongly shaped by team environment, not just individual brilliance. Psychological safety, dependability, structure and clarity, meaning, and impact repeatedly showed up as the conditions that enable teams to execute consistently.
Team dynamics vs. team performance: what’s the difference?
- Team performance is what the team delivers: output, quality, speed, customer outcomes.
- Team dynamics are the mechanisms that produce that performance: how the team coordinates, decides, and corrects course.
Performance can look “fine” right up until it isn’t. Dynamics usually give you earlier warning signs.
Why team dynamics matter for team performance and team success
When dynamics are weak, the team pays a tax on everything:
- Decisions take longer than they should.
- Problems surface late (or not at all).
- Meetings multiply because nothing sticks.
- High performers carry the load until they leave.
- Leaders end up “managing mood” instead of managing execution.
This isn’t philosophical. It’s operational.
Gallup’s meta-analysis work on engagement consistently shows meaningful gaps between highly engaged and low-engaged business units on outcomes like profitability, productivity, and turnover. If you want a single reason to take dynamics seriously, it’s this: engagement and team environment are not “culture projects,” they are performance levers, and understanding what truly motivates and drives your people is central to sustaining that engagement.
The hidden costs of weak team dynamics
Weak dynamics create predictable failure modes:
- Silent risk: People withhold concerns because speaking up feels unsafe or pointless.
- Ambiguity loops: Roles and decision rights aren’t clear, so work bounces around.
- Conflict avoidance: Tension gets buried, then leaks out as sarcasm, delays, and attrition.
- Coordination drag: Teams spend energy translating expectations instead of executing.
Amy Edmondson’s work on psychological safety is useful here because it’s often misunderstood. Psychological safety is not “being nice.” It’s a shared belief that candor won’t be punished, which is what allows teams to correct mistakes early, learn fast, and avoid preventable failures.
What high-performing teams do differently
High-performing teams usually share a few boring, repeatable traits:
- Clarity on priorities and trade-offs.
- Fast feedback loops (problems surface early).
- Reliable execution (commitments mean something).
- Productive conflict (ideas get challenged, people don’t get attacked).
- A leader who models candor and sets norms, not just goals.
A team dynamics assessment doesn’t “create” these traits. It tells you which ones are missing and what’s causing the gap, so your interventions stop being random.
How do you assess team dynamics? A practical step-by-step process
This is where most companies get it backwards. They buy a tool, run a survey, then stare at the results like they’re reading tea leaves.
Do it in this order.
Step 1: Define assessment goals tied to business outcomes
Be specific. Examples:
- Reduce cross-functional friction that’s slowing launches.
- Improve decision speed without sacrificing quality.
- Reduce rework caused by unclear ownership.
- Stabilize a team after a re-org or leadership change.
If the goal is “team building,” you’ll get team-building results: vague and temporary.
Step 2: Identify stakeholders and decision owners
At minimum, you need:
- A decision owner (often the team leader or exec sponsor).
- HR / People partner (to protect process integrity and privacy).
- A facilitator (internal or external) who can run the review session without turning it into blame.
Step 3: Choose what success looks like and set baseline dates
Pick a small set of outcomes you can track alongside the assessment, such as cycle time, quality defects, customer escalations, missed handoffs, or regrettable turnover.
If you don’t set a baseline date, you can’t credibly claim improvement later. You can only claim you “feel better,” which is not a strategy.
Step 4: Select an assessment tool aligned to your goals
Selection criteria that matter:
- Measures the dynamics you actually care about (not generic engagement fluff).
- Produces team-level reporting with safe aggregation.
- Gives clear, actionable outputs, not just labels.
- Fits your team context (hybrid, global, matrixed, cross-functional).
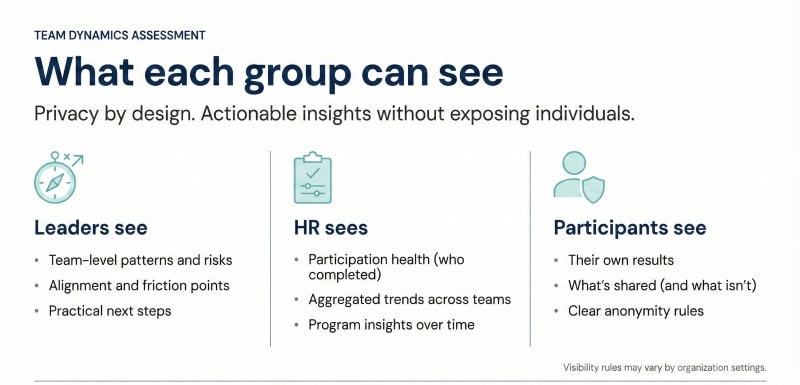
Step 5: Set up privacy and anonymity
If people think they’ll be identified, they will lie politely.
At minimum:
- Report results at team level, not individual level.
- Use an anonymity threshold (for example, don’t show subgroup breakdowns if the subgroup is too small).
- Be explicit about who will see what.
Step 6: Participant onboarding, time estimates, consent, and optional demographics
Keep onboarding brief and practical:
- Why this is happening now.
- How long it takes (give a real number).
- How anonymity works.
- What will happen after results are in.
Optional demographics can help analysis, but only collect what you will actually use, and only when it won’t compromise anonymity.
Step 7: Collect data (survey + optional qualitative prompts)
Using a fast, validated personality questionnaire like the OAD Survey tool alongside your team dynamics questions can give you deeper behavioral context for what you see in the results.
A clean setup:
- Survey items for quant measurement.
- 2–4 open-ended prompts like:
- “What slows this team down most?”
- “What should we do more of, less of, start, stop?”
- “Where do you feel least clear?”
Open text is powerful, but it must be handled as themes, not quotes pinned to people.
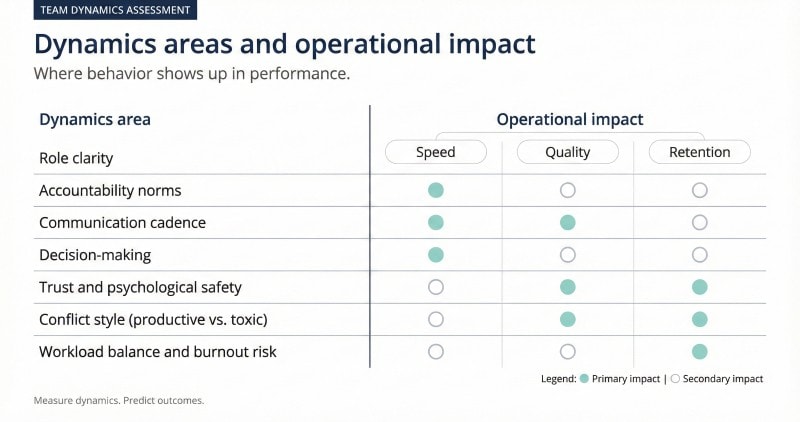
What to measure in a team dynamics assessment
If you measure the wrong things, you get the usual corporate outcome: a colorful report and no change. Measure dynamics that directly affect execution, and consider layering in behavior fit reports that match roles to personality so you can see where misalignment in expectations is driving friction.
Team cohesion metrics
Cohesion is not “everyone likes each other.” It’s whether the team can coordinate without constant friction.
Measure:
- Trust: People assume competence and good intent until proven otherwise.
- Psychological safety: People speak up early, not after the damage is done. Edmondson defines it as a shared belief that the team is safe for interpersonal risk taking.
- Shared purpose: People understand why the work matters, not just what they’re doing.
- Dependability: Commitments get delivered, reliably and on time. Google’s team effectiveness work highlights dependability as a core condition.
Practical signals cohesion is weak:
- People “agree” in meetings and disagree in private.
- Issues surface late through side channels.
- Collaboration feels expensive, so work gets hoarded.
Team functioning metrics
Functioning is the operating system. When it’s broken, even good people look incompetent.
Measure:
- Structure and clarity: Roles, priorities, and decision rights are explicit. Google’s team effectiveness guide calls out structure and clarity as a key condition.
- Decision-making: Decisions are made at the right level, documented, and followed.
- Accountability: Ownership is clear, and missed commitments get handled, not ignored.
- Execution hygiene: Handoffs, timelines, and quality checks are consistent.
Practical signals functioning is weak:
- Work bounces between people because no one “owns” it.
- Projects stall waiting for approvals that nobody can name.
- Teams over-meet because decisions never stick.
[Image: Flowchart of a simple decision process (recommend, decide, execute, review). Alt: “Team decision-making clarity as part of a team dynamics assessment”]
Collaboration and communication metrics
Most “communication problems” are really system problems: unclear priorities, unclear incentives, unclear ownership.
Measure:
- Information flow: The right people get the right info early enough to act.
- Feedback quality: Feedback is specific, timely, and behavior-based.
- Conflict patterns: Disagreement is surfaced and resolved, not suppressed.
- Cross-boundary coordination: Functions and locations can work together without drama.
If you want one hard, ugly number to justify caring: SHRM cited i4cp research estimating an average 39% productivity loss from poor collaboration, rising to 60% for the least effective teams.
[Image: Remote and in-office participants collaborating on a shared document with clear comments and owners. Alt: “Collaboration and communication metrics for team effectiveness”]
Performance indicators to monitor alongside the assessment
Beyond basic KPIs, leading indicators of burnout, disengagement, or flight risk—such as OAD’s risk and readiness alerts—can help you spot issues early and connect your team dynamics data to retention decisions.
A team dynamics assessment should not float in a vacuum. Track a small set of outcomes that matter to the business. Keep them industry-neutral so the model works globally.
Pick 3–6 indicators like:
- Cycle time: How long work takes from start to finish.
- Rework rate: How often work gets redone due to unclear requirements or handoffs.
- Quality defects: Escapes, errors, customer complaints, incident rates.
- Decision latency: Time from issue raised to decision made.
- Regrettable turnover / retention risk: Especially in key roles.
- Stakeholder satisfaction: Simple internal customer pulse scores.
Linking dynamics to outcomes is where leaders stop treating this like a “culture initiative” and start treating it like operational control.

Turning results into insights: analysis methods that actually help
Most teams don’t need “more data.” They need a way to turn messy opinions into decisions without turning the assessment into a blame festival.
This section is the bridge: raw responses → patterns → priority actions.
Aggregate individual results into team-level patterns
Start with team-level reporting. That’s the only level where most teams will answer honestly.
Do three simple cuts first:
- Overall team average by competency (trust, clarity, accountability, communication, conflict, etc.)
- Top strengths (highest scoring areas with consistent agreement)
- Biggest constraints (lowest scoring areas that directly affect execution)
Avoid over-interpreting tiny differences. If two areas are close, treat them as the same tier and focus on what changes outcomes fastest.
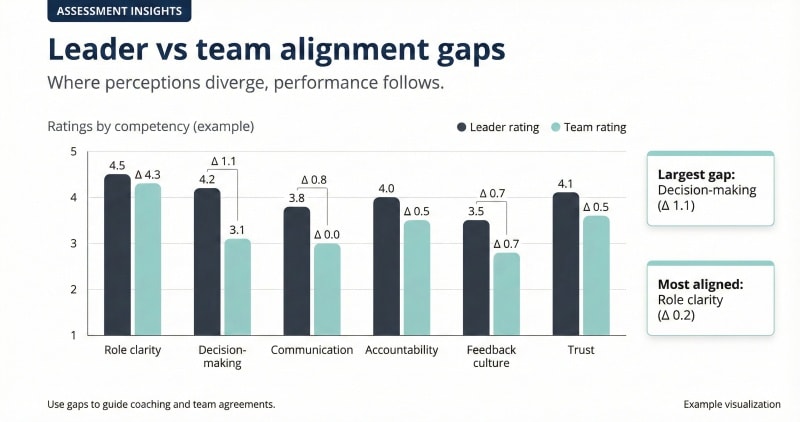
Compare leader ratings vs. team averages (alignment gaps)
This is where reality tends to get entertaining.
When leaders and teams disagree, it usually means one of these is true:
- The leader has a different definition of “good.”
- The leader sees intent; the team feels impact.
- The leader is getting filtered information.
- The team is holding back concerns until it’s too late.
How to use this cut responsibly:
- Flag directional gaps (leader higher than team, or leader lower than team).
- Treat gaps as hypotheses to test in the results review, not verdicts.
- Use “What would we observe if this were true?” to ground the discussion.
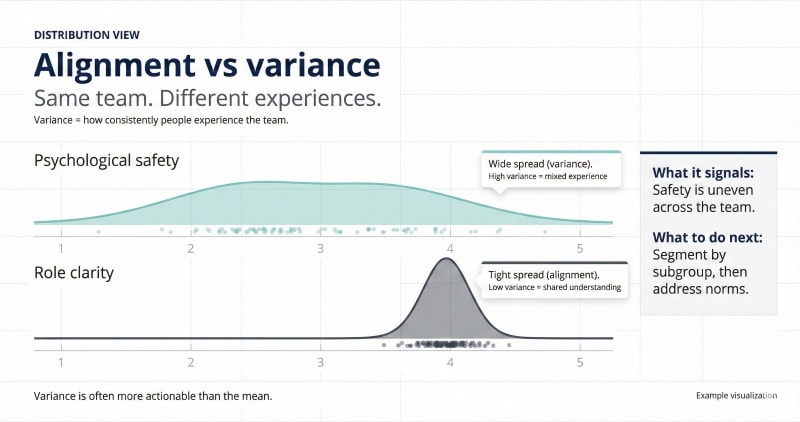
Identify high-variance items (where the team disagrees most)
Low averages tell you what’s weak. High variance tells you what’s inconsistent, which is often where dysfunction hides.
High variance usually means:
- Different subgroups experience the team differently.
- Norms aren’t shared (some people think something is fine, others think it’s broken).
- The team is split by tenure, location, function, or seniority.
Practical use:
- Pick the 3–5 highest-variance items.
- Turn each into a discussion prompt:
- “What’s happening that makes people answer this so differently?”
- “Where does this show up in the work week?”
Segment carefully without breaking anonymity
Segmentation can uncover real causes, or it can destroy trust instantly. Use it only when:
- You have enough respondents per subgroup to protect identity.
- You’re committed to acting on what you learn.
- You can explain the purpose clearly.
Safe, common segmentation lenses:
- Location (only if groups are large enough)
- Function (Sales vs Product vs Ops)
- Tenure bands (new vs established)
- Role level (IC vs manager)
Rules that keep this from going sideways:
- Never report results for tiny groups.
- Never weaponize segmentation (“This department is the problem”).
- Always frame it as a system insight (“This workflow creates a different experience depending on role”).
Sanity-check the data before you act
Before you jump into recommendations, run quick checks:
- Response rate: Low response usually means low trust or low relevance. Treat it as a finding.
- Pattern consistency: Are the low areas echoed in open-ended themes?
- Bias signals: Are responses extremely positive across the board with little variance? Could be genuine, could be fear, could be survey fatigue.
- Timing effects: Re-orgs, layoffs, leadership changes, peak season. Context matters.
Reporting: what “valuable insights” should look like
A report is only useful if it changes what people do on Monday. Anything else is corporate scrapbooking.
Good reporting is:
- Clear enough that a busy exec can scan it in five minutes.
- Specific enough that a team can act on it without guessing.
- Safe enough that people will participate again.
Visual dashboards and what each one is good for
Use visuals that match the decision you’re trying to drive.
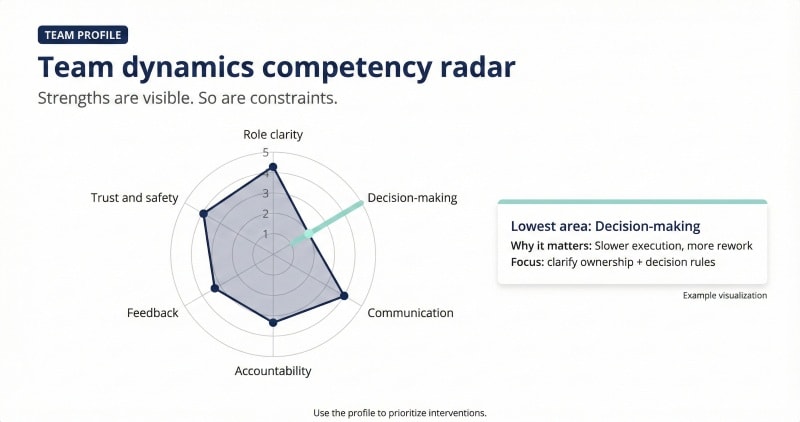
Radar charts (competency profiles)
Best for: showing a quick “shape” of the team across major areas (clarity, trust, conflict, accountability, etc.).
Watch-out: radars can hide small but important gaps. Use them for overview, not precision.
Bar charts (team averages)
Best for: comparing strengths vs constraints at a glance.
Watch-out: don’t pretend a 0.1 difference is meaningful unless you have a clear reason.

Distribution charts (score spread)
Best for: spotting disagreement inside the team. Averages lie. Distributions show whether the team is aligned or split.
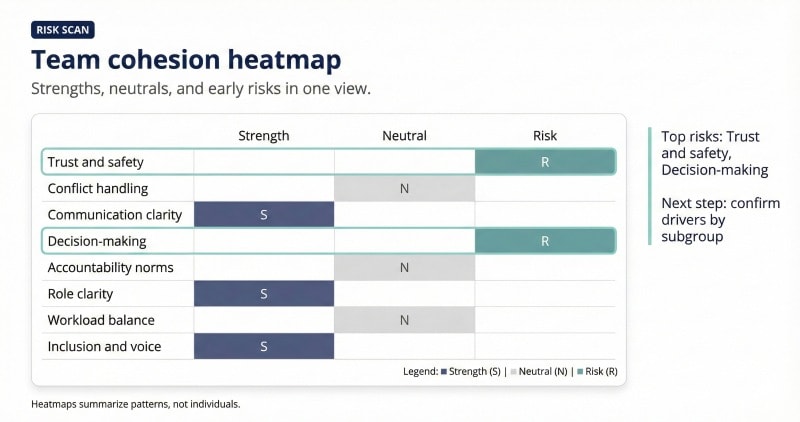
Heatmaps (items by theme)
Best for: scanning where pain clusters (for example, decision-making + accountability both weak).
Watch-out: don’t overload the team with too many items. Curate.
Strengths, risks, and watch-outs for team cohesion
Your report should separate:
Strengths (protect these):
High scores with low variance. These are stable assets.
Constraints (fix these first):
Low scores with direct operational impact. These are bottlenecks.
Risks (monitor closely):
Areas that may not be the lowest score, but correlate with failure patterns, especially:
- Psychological safety
- Decision clarity
- Accountability
- Conflict avoidance
Google’s team effectiveness findings point to conditions like psychological safety, dependability, and structure/clarity as core enablers. If these are weak, treat it as an early warning sign for performance issues, not a “soft” problem—and back your decisions with a psychometrically precise assessment like the OAD Survey so you’re not guessing about underlying traits.
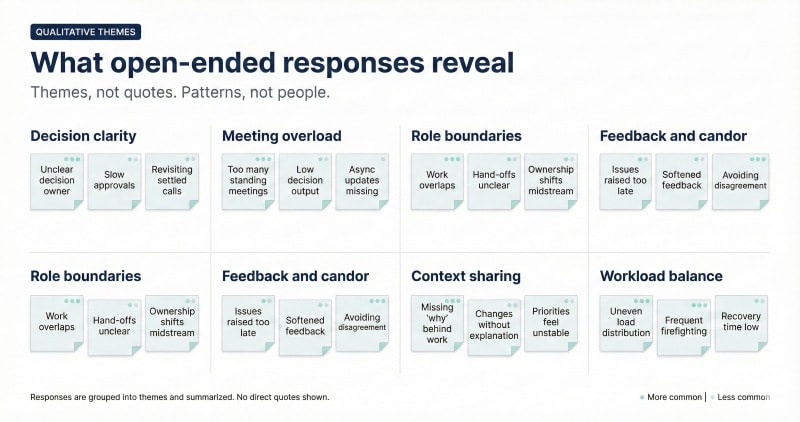
Using open-ended responses responsibly (themes, not witch hunts)
Open-ended comments can be the most valuable part of the assessment, because they explain why the scores look the way they do.
They can also destroy trust if handled badly.
Use a simple approach:
- Theme coding: group responses into 5–10 themes (for example: “unclear priorities,” “slow decisions,” “conflict avoidance,” “too many meetings,” “information silos”).
- Frequency + impact: identify which themes show up often and which themes are high impact even if less common.
- Representative phrasing: paraphrase themes in plain language rather than quoting verbatim unless you have explicit consent and strong anonymity protection.
Rules that keep this safe:
- Never read raw comments aloud in a way that invites guessing who wrote them.
- Never use comments to “prove” a point. Use them to explore causes.
- Always pair a theme with a next step (“If this is true, what do we change?”).
What a strong report includes (minimum viable)
For most teams, this is the practical set:
- A one-page leader summary: top strengths, constraints, risks, 3 recommended moves.
- A team-facing summary: what we learned, what we’ll do, what will be tracked.
- A short appendix: method notes, participation rate, and privacy rules.
From insights to action: recommendations that improve team dynamics
Insights are cheap. Action is where teams either get better or return to their favorite hobby: discussing problems with no consequences.
This section is about translating findings into moves that change behavior, not just attitudes—for example, turning insights about sales friction into concrete steps to build and coach a winning sales team instead of generic “sell more” messages.
Prioritize the top 3 development opportunities (don’t boil the ocean)
Most teams can only execute a small number of changes at once. If you give them ten “focus areas,” you are really giving them zero.
A practical prioritization filter:
- Impact: If this improves, does team performance measurably improve?
- Leverage: Does this remove friction across multiple workflows?
- Feasibility: Can the team make progress in 30–60 days?
- Trust: Will action here increase confidence in the process?
Typical top priorities that show up across organizations:
- Decision clarity (who decides, by when, based on what inputs)
- Accountability (what “done” means and how commitments are tracked)
- Feedback and conflict hygiene (how issues are raised and resolved)
- Role clarity in cross-functional work (ownership and handoffs)
Recommend behavior-based actions tied to business outcomes
Avoid “improve communication.” That’s not an action. It’s a wish.
Use this structure instead:
- Finding: What the data says in plain language.
- Operational cost: What it is doing to speed, quality, retention, or customer outcomes.
- Behavior change: What needs to happen differently, specifically.
- Mechanism: The routine or rule that makes it stick.
- Metric: What you will track for 30–90 days.
Example (decision latency):
- Finding: Decisions are unclear and often revisited.
- Operational cost: Delays, rework, escalation loops.
- Behavior change: One named decision owner per decision, with a deadline.
- Mechanism: A decision log + a weekly 15-minute decision review.
- Metric: Time from issue raised to decision made.

Common interventions that reliably improve team dynamics
Coaches and advisors who support these changes can go deeper, faster when they use behavioral coaching tools powered by data to see how leaders respond under stress, communicate, and make decisions.
These are boring. That’s why they work.
1) Communication norms (reduce noise, increase clarity)
- Set response-time expectations by channel (chat vs email vs meeting).
- Require agendas for meetings that involve decisions.
- End meetings with decisions, owners, and next steps written down.
2) Decision rights (speed up execution)
Use a simple decision model and stick to it. For example:
- Recommend: who brings the proposal
- Decide: who has final call
- Input: who must be consulted
- Execute: who owns delivery
The exact framework matters less than consistency.
3) Conflict agreements (make disagreement productive)
- Define what “good conflict” looks like (challenge ideas, not people).
- Define the escalation path when conflict stalls decisions.
- Normalize “disagree and commit” once a decision is made.
4) Role clarity (stop the handoff chaos)
- Create a one-page ownership map for cross-functional workflows.
- Clarify what is owned by the team vs owned by stakeholders.
- Define “definition of done” for recurring outputs.
5) Accountability routines (make commitments real)
- Weekly commitments review (15 minutes, not a ceremony).
- Visible task ownership (not hidden in someone’s notebook).
- Handle misses consistently: what changed, what’s blocked, what’s the new plan.
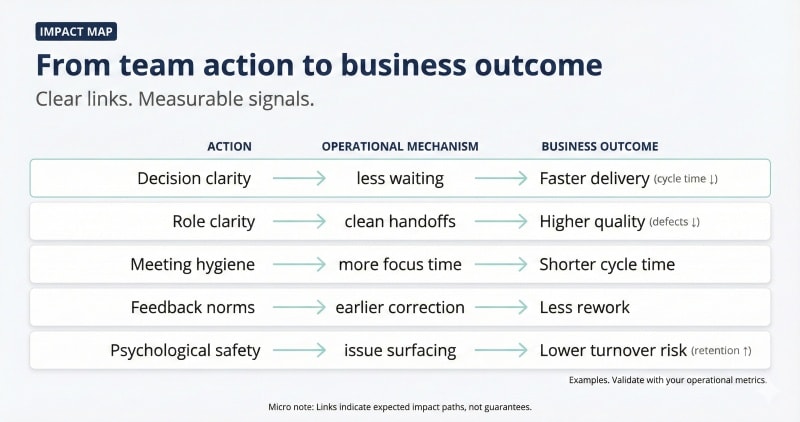
Align recommendations with business outcomes
Leaders don’t invest in “team cohesion” because it sounds nice. They invest because it protects execution, especially for founders and CEOs who are hiring and promoting with long-term fit in mind.
Tie each recommendation to one of:
- Faster cycle time
- Lower rework and fewer defects
- Better stakeholder outcomes
- Lower regrettable turnover
- Better delivery predictability
If you can’t connect an action to an outcome, it’s probably a feel-good activity.
Leadership development based on team dynamics findings
Most “team problems” are leadership system problems. Not because leaders are villains. Because leaders set incentives, norms, and what gets reinforced. Teams adapt accordingly.
A team dynamics assessment is especially useful here because it gives leaders something they rarely get: a structured view of how their team experiences the environment.
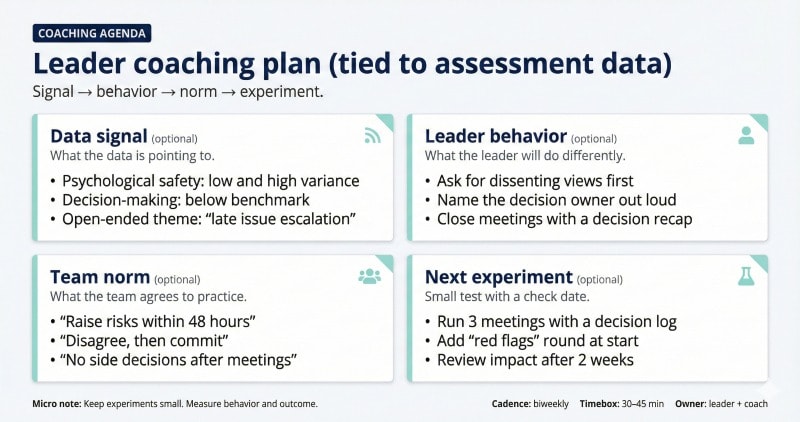
Coaching topics for the team leader (based on the data)
Good coaching topics come straight from the gaps, not from generic leadership bingo.
Common high-impact coaching areas tied to team dynamics findings:
Decision-making clarity
When the assessment shows slow decisions or repeated revisiting:
- Clarify decision ownership and deadlines.
- Stop “consensus by exhaustion.”
- Make trade-offs explicit and visible.
Psychological safety and candor
When people hesitate to raise concerns:
- Model fallibility: admit a mistake early, publicly, and without drama.
- Reward early bad news (because late bad news is expensive).
- Ask better questions in meetings: “What are we missing?” “Who disagrees?” then wait.
Amy Edmondson’s research emphasizes that psychological safety enables learning behavior, speaking up, and error reporting, all of which matter for performance in complex work.
Accountability and follow-through
When commitments slip:
- Define “done” and checkpoints.
- Make ownership visible.
- Address misses consistently, without public shaming.
Role clarity and delegation
When teams report confusion or duplication:
- Reset roles and interfaces, not just tasks.
- Delegate outcomes with guardrails, not step-by-step control.
Conflict hygiene
When conflict is avoided or gets personal:
- Normalize debate on ideas.
- Stop meetings from becoming proxy wars.
- Use structured debriefs after tense moments.
Leader-led feedback sessions and how to run them without derailing trust
The results meeting is where most leaders accidentally torch the whole process.
The goal is not to defend the leader. The goal is to create a shared view of reality and agree on the next few changes.
A practical structure for a 60–90 minute session:
1) Open with intent and boundaries (5 minutes)
- Why the assessment happened.
- What anonymity means.
- What will and will not happen (no targeting individuals, no “who wrote that”).
2) Share the headline pattern (10 minutes)
- 2 strengths to protect.
- 2 constraints to fix.
- 1 risk to monitor.
Keep it simple. If you dump 20 slides, people stop listening.
3) Validate before solving (15 minutes)
Use neutral prompts:
- “Where do you see this in our work?”
- “What’s the cost when this happens?”
- “What would ‘better’ look like in a normal week?”
This prevents the classic failure: jumping to solutions before the team agrees on the problem.
4) Pick the top 3 moves (20–30 minutes)
For each move:
- Define the behavior change.
- Assign an owner.
- Set a time box (30–60 days).
- Pick a metric or observable signal.
5) Close with commitments and a re-check date (5 minutes)
- What happens next week.
- When you will review progress.
- When you will re-assess or run a pulse.
What leaders should not do (if they enjoy trust)
- Argue with the data in the room.
- Ask people to identify themselves.
- Cherry-pick positives and ignore constraints.
- Promise “big changes” without owners and timelines.
- Treat the assessment like a referendum on leadership.
If you want participation next time, the team needs to see that speaking up leads to action, not consequences.
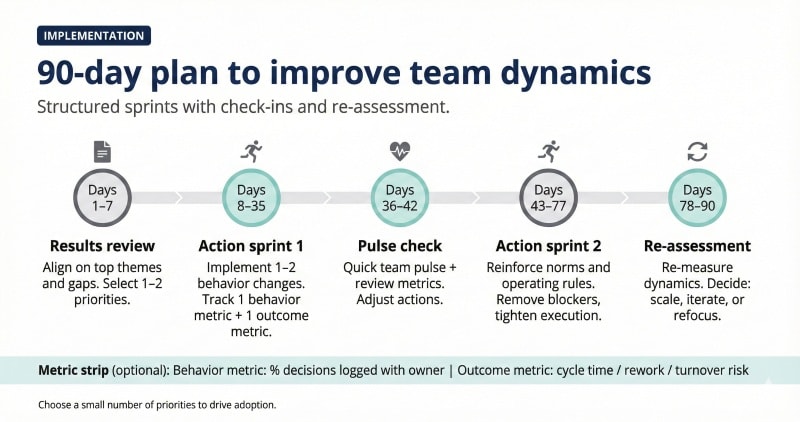
Implementation plan: how to improve team dynamics over time
This is the part where organizations usually fall apart. They do the assessment, have an emotional meeting, then go back to the same habits because nobody owns the change.
An implementation plan makes improvement unavoidable.
Schedule the team results review session (who attends, what gets shared)
Minimum attendees:
- Team leader (decision owner)
- Full team (or the assessed unit)
- HR/People partner (process integrity, privacy)
- Facilitator (optional but often useful for neutrality)
What gets shared:
- Team-level patterns only
- Strengths, constraints, risks
- Clear privacy rules (again, because humans forget rules when emotions show up)
What does not get shared:
- Raw individual responses
- Small subgroup breakouts that risk identification
- Verbatim comments that invite guessing
Assign owners for each recommended action
Every action needs:
- One owner (not “we”)
- A deadline
- A definition of done
- A check-in cadence
If ownership is unclear, the team learns a lesson: nothing matters.
A simple ownership model that works globally:
- Leader owns: decision rights, norms, escalation paths, resourcing trade-offs
- Team members own: running the routines, raising issues early, following norms
- HR/People partner owns: measurement cadence, privacy compliance, support resources
Set measurable success criteria and timelines
You do not need complex metrics. You need observable change.
Set two types of measures:
1) Operational measures (business outcomes)
Pick 2–4 that match your original goals:
- Cycle time
- Rework rate
- Decision latency
- Defect or escalation rates
- Regrettable turnover risk
2) Behavioral measures (leading indicators)
Pick 2–4 that show whether dynamics are improving:
- Commitments delivered per week (and misses handled consistently)
- Meetings ending with written decisions and owners
- Issues raised earlier (fewer late surprises)
- Faster resolution of cross-functional blockers
Time horizon:
- 30 days: routines installed, owners active, early friction reduced
- 60 days: consistent execution of routines, visible behavior shift
- 90 days: measurable movement in at least one operational indicator
Build a cadence: re-assessment and quarterly pulse surveys
A good cadence balances learning and survey fatigue.
Common approach:
- Quarterly pulse surveys (3–8 items) focused on the top priorities
- Re-assessment every 6–12 months for the full team dynamics questionnaire
Pulse surveys should be narrowly scoped:
- “Are decisions clearer than last quarter?”
- “Are blockers raised earlier?”
- “Do we leave meetings with owners and next steps?”
If you pulse on everything, you learn nothing.
Review progress in regular leadership meetings
Make the improvement plan part of existing rhythm, not a separate initiative.
A lightweight monthly review:
- What actions are complete?
- What changed in behavior?
- What moved in the operational indicators?
- What is the next constraint?
If the answer is always “we’re too busy,” then the team has its real problem: priorities are not real.
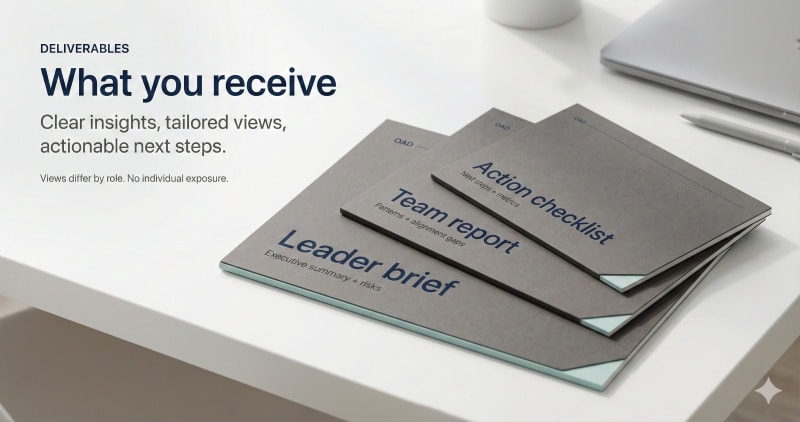
Deliverables: what a strong assessment output includes
Deliverables are not decoration. They’re the “handoff” between insight and execution. If your outputs are vague, you get vague follow-through.
A strong team dynamics assessment typically produces three layers: leader-facing, team-facing, and execution-facing.
Leader brief (one-page, decision-oriented)
This is for leaders who don’t have time to read a novel about feelings.
Include:
- Headline: one sentence on the team’s current operating reality
- Top 2 strengths: what to protect and reinforce
- Top 2 constraints: what is most limiting team performance
- Top risk: what could derail team success if ignored
- Leader-team alignment gaps: where leader perception differs from the team’s
- Recommended next 3 moves: actions, owners, timeline, and the expected outcome
Keep the language concrete. Example:
- Not: “Improve collaboration.”
- Yes: “Implement decision ownership and a decision log for cross-functional approvals to reduce decision latency.”
Team-facing report (clear, safe, action-focused)
This output has one main job: build shared understanding without creating fear.
Include:
- What was measured and why
- Participation rate and anonymity rules
- Strengths and constraints in plain language
- 3 priorities the team will focus on
- What will change in routines (meetings, decisions, handoffs, feedback norms)
- When the team will review progress
Avoid:
- Overly detailed segmentation
- Loaded language (“toxic,” “dysfunctional”)
- Anything that invites people to guess who said what
If you want people to be honest again, you must show them it’s safe to be honest.
Implementation checklist (turn insights into tasks)
This is the execution layer. It should be copy-paste-ready into whatever task system the organization uses.
Include for each action:
- Action name
- Owner
- Start date and target date
- Definition of done
- Metric or observable signal
- Check-in frequency
- Dependencies or required support
Example actions that translate well into tasks:
- “Create decision rights map for top 5 recurring decisions”
- “Add 10-minute commitments review to weekly team meeting”
- “Define definition of done for X workflow and publish in shared workspace”
- “Run monthly 30-minute retro focused on the top 1 constraint”
Optional (but often useful) deliverables
These are helpful when the team is large, global, or cross-functional:
- Facilitator guide: meeting structure + prompts + rules
- Dashboard view: trend lines for the top priorities over time
- Stakeholder summary: what adjacent teams need to know (without oversharing)
Follow-up: next steps and continuous improvement
Assessments only matter if you revisit them. Otherwise, you just paid for a snapshot of dysfunction.
Schedule re-assessment cadence
Use cadence that matches how fast the team changes:
- Stable teams: re-assess every 12 months
- Teams in change (new leader, re-org, rapid growth, merger integration): re-assess every 6 months
Re-assessment is not a reward. It’s measurement. If you only re-assess when things feel good, you’re managing optics, not performance.
Run short pulse surveys quarterly
Quarterly pulses keep attention on the few changes that matter most without creating survey fatigue.
Pulse rules:
- 3–8 items max
- Only measure the top 2–3 priorities from the original assessment
- Include one open text prompt, optional:
- “What’s improved?”
- “What’s still getting in the way?”
Review progress in regular leadership meetings
Don’t invent a new meeting. Add a short block to existing leadership rhythm.
Monthly review agenda (15–20 minutes):
- What actions are complete?
- What changed in team behavior?
- What moved in operational indicators?
- What’s the next constraint?
- What support is needed (resources, decision, escalation)?
If the review keeps getting skipped, treat that as a signal: leadership priorities are not credible to the team.
Privacy, security, and administration
This is where trust either gets protected or quietly killed.
Anonymize individual responses before reporting
Minimum privacy standards:
- Report at team level
- Use an anonymity threshold for any subgroup view (don’t show small groups)
- Avoid verbatim quotes unless you can guarantee anonymity
If people fear identification, your data quality collapses. You’ll get polite lies.
Store data in encrypted, access-controlled systems
Baseline controls:
- Encryption at rest and in transit
- Role-based access (HR/admin vs leader vs participant views)
- Audit logs for access where possible
- Retention rules (don’t keep sensitive raw data forever “just in case”)
Global note: privacy expectations vary
If you operate across regions, align with the strictest reasonable standard and make it explicit in onboarding. The point is not legal theater. It’s credible trust.
FAQ: Team dynamics assessment questions (People Also Ask)
How do you assess team dynamics?
Use a structured process:
- Define the business outcomes you want to improve.
- Run a team dynamics questionnaire with anonymity protections.
- Analyze team-level averages, leader-team gaps, and high-variance items.
- Review results with the team using a facilitated, non-blaming structure.
- Commit to 2–3 actions with owners, timelines, and measures.
- Pulse quarterly and re-assess in 6–12 months.
What are 5 examples of team dynamics?
Five common dynamics that show up in real teams:
- Psychological safety (speaking up, candor)
- Decision-making clarity (who decides, how fast)
- Accountability (commitments, follow-through)
- Conflict patterns (avoidance vs productive debate)
- Communication flow (early sharing vs late surprises)
What is a team dynamics questionnaire?
It’s a survey that measures how the team functions in areas like trust, cohesion, communication, conflict, role clarity, and accountability. The best questionnaires focus on observable behaviors and conditions, and they report results at team level to protect anonymity.
What are the 5 dynamics of an effective team?
Different models use different labels, but effective teams tend to share five conditions:
- Safety to be candid
- Dependability in delivery
- Clarity on roles and priorities
- Healthy debate and fast decisions
- Shared purpose and visible impact
How often should you re-assess team dynamics?
Typically:
- Every 12 months for stable teams
- Every 6 months during high change
- Quarterly pulses in between focused on the top 2–3 priorities
What should you do after a team dynamics assessment?
Three moves:
- Run a results review session and agree on the headline problem, not 20 problems.
- Commit to top 3 changes with owners and deadlines.
- Build a cadence: weekly routines, monthly leadership review, quarterly pulse.
Conclusion: building a shared language for team performance
A team dynamics assessment is not therapy and it’s not a vibe check. It’s a way to make the invisible system visible, so leaders can manage execution with something better than guesswork.
When teams have shared language for what’s working and what’s not, they stop wasting energy on interpretation and start spending it on delivery.
If you want to see how OAD performs on your own roles and teams, you can test OAD for free and compare your next decisions with data instead of gut feel.