Most businesses say they “use data.” What they often mean is they look at reports after the decision is already made.
The amount of data generated today is staggering—some estimates show that 90% of the world’s data has been created in just the last few years. This explosion of big data means organizations have unprecedented opportunities to leverage information for better decision-making.
Data-driven decision making flips that. You start with a decision you need to make, then use relevant data to reduce uncertainty, test assumptions, and choose the option most likely to produce a better outcome. The goal is not just to collect information, but to extract real insights from big data that can inform your strategy.
This matters because human judgment is fast, confident, and frequently wrong in predictable ways. Data does not make you smart. It makes you harder to fool, especially by your own opinions. Data-driven decision-making leads to more informed decisions and isn’t just a buzzword—it’s a game-changer for organizations.
Table of Contents
- What Is Data-Driven Decision Making?
- The Importance of Data-Driven Approaches
- How Do You Use Data for Decision-Making?
- Data Quality: The Part That Quietly Ruins Everything
- Creating a Data-Driven Culture
- Examples of Using Data to Make Decisions (By Function)
- Actionable Insights for Business Decisions
- How to Tell If It Worked (KPIs That Match the Decision)
- FAQ: Examples of Using Data to Make Decisions
- Conclusion: Turning Data into Better Outcomes
What Is Data-Driven Decision Making?
Data-driven decision making is a structured decision making process where you use data analysis to guide choices, instead of relying mainly on intuition, anecdotes, or the loudest person in the room.
In practice, it usually draws from two types of data:
- Historical data: What happened before. Useful for patterns, seasonality, and benchmarking.
- Real-time data: What is happening now. Useful for fast-moving situations like demand shifts, operational issues, or customer experience signals.
Descriptive analytics helps organizations answer questions about what happened by analyzing past data, while diagnostic analytics is used to review historical data to answer questions and solve problems.
A data-driven approach does not mean “more data.” It means better decisions: clearer inputs, fewer assumptions, and measurable outcomes. The goal is not perfect certainty. The goal is higher odds.
In business, this applies everywhere: pricing, inventory, marketing, customer retention, and people decisions like hiring and internal mobility. Any decision with repeatable outcomes can get better when it is based on evidence instead of vibes.
The Importance of Data-Driven Approaches
In today’s rapidly evolving business landscape, data driven decision making has become a game changer for organizations aiming to achieve their strategic goals and long-term success. By leveraging data analytics and data analysis, companies can move beyond gut feelings and anecdotal evidence, instead basing their business decisions on accurate, relevant data. This shift enables leaders to uncover valuable insights that drive growth, optimize inventory management, and improve customer satisfaction scores.
Data driven approaches empower organizations to identify market opportunities and respond proactively to changing trends. Rather than relying solely on historical data or intuition, businesses can use real-time and reference data to make informed decisions that enhance operational efficiency and customer experience. Whether it’s streamlining supply chains, refining marketing strategies, or improving product offerings, decisions based on data help reduce risk and maximize resources.
Ultimately, embracing data driven decision making ensures that every action is grounded in reality, leading to better outcomes, increased competitiveness, and a stronger foundation for future growth.
How Do You Use Data for Decision-Making?
Most teams get this backwards. They start with a dashboard, then go hunting for a decision that justifies it. Instead, teams should dive deeper into their data to uncover data-driven insights, rather than just relying on dashboards. The cleaner approach is a simple loop you can repeat without needing a data science department.
1) Define the decision, not the analysis
Be specific about what you are choosing between.
Bad: “We need to improve recruiting.” Better: “Which two sourcing channels should we double down on for sales hires in Q2?” Best: “Should we reallocate 30% of budget from job boards to referrals and outbound, based on qualified applicants and time-to-fill?”
A decision has a scope, a time frame, and a tradeoff.
Defining the decision clearly at this stage helps set achievable goals. Data-driven decision-making supports better strategic planning by enabling organizations to set these goals and stay ahead of the competition.
2) Pick 1–3 metrics that define “better”
If you cannot name what success looks like, you are not doing data-driven decision making. You are doing data-themed storytelling.
Choose a small set of measures that match the decision. Examples:
- Marketing: qualified leads, conversion rate, CAC, retention
- Operations: cycle time, error rate, cost per unit, on-time delivery
- Hiring: quality of hire, time-to-fill, pass-through rates, turnover at 90/180 days
This is also where you decide what you will not optimize, because everything has a cost.
To ensure the right metrics are chosen and tracked, it is important to use strategies based on structured approaches, such as establishing data governance and ongoing measurement.
3) Gather relevant data and sanity-check quality
Use the most relevant data sources you already have before adding new ones: CRM, ATS, support tickets, product usage, web analytics, finance, operational logs, survey data.
Then do a quick quality check:
- Is it accurate enough to trust directionally?
- Is anything missing that would change the conclusion?
- Are you mixing apples and oranges (different teams, markets, or time periods)?
If the data is messy, say so. The decision can still be made, but with the right level of confidence.
4) Analyze for patterns, then pressure-test the story
You are usually looking for one of three things:
- A trend (up/down over time)
- A comparison (A vs B)
- A relationship (what changes when something else changes)
Then pressure-test it with common-sense checks:
- Could this be seasonality?
- Did something else change at the same time?
- Are we seeing correlation, not cause?
If you are using predictive analytics or machine learning, treat outputs like a recommendation, not a verdict. Models are powerful. They are also confident liars when the inputs are biased.

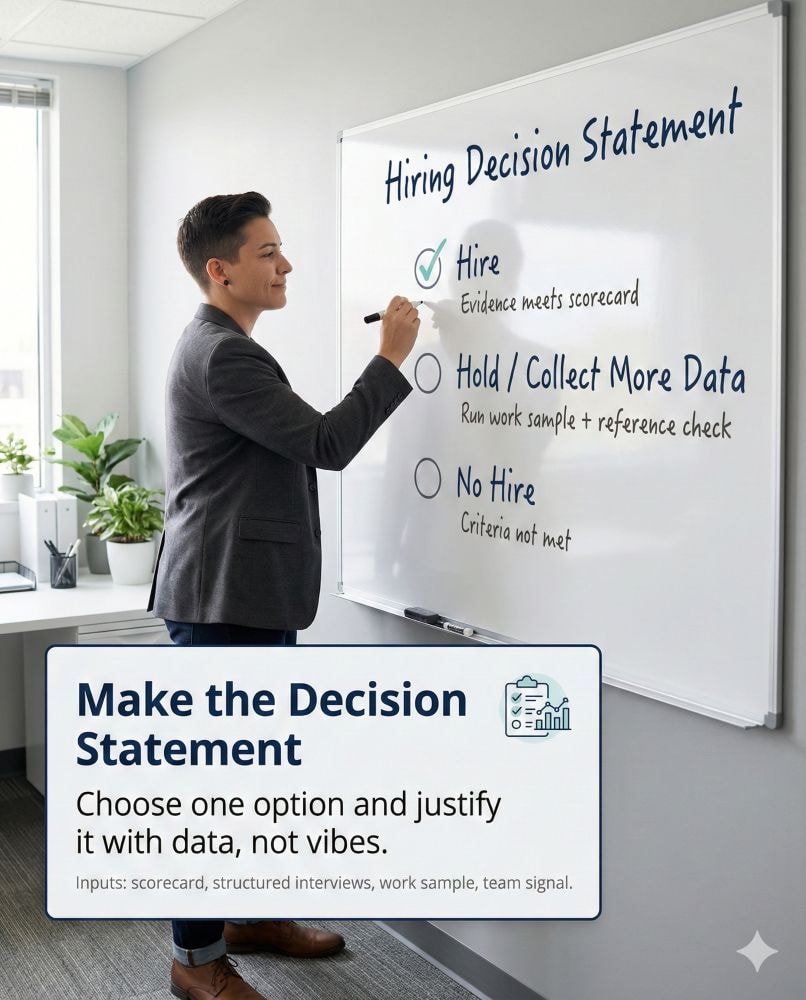
5) Decide, act, and measure the outcome
A data-driven decision is incomplete until it produces a measurable result.
Write down:
- What you decided
- Why you decided it (key data insights)
- What you expect to happen
- When you will review it
This creates a feedback loop. Over time, you stop repeating the same debates because you can point to outcomes, not opinions.
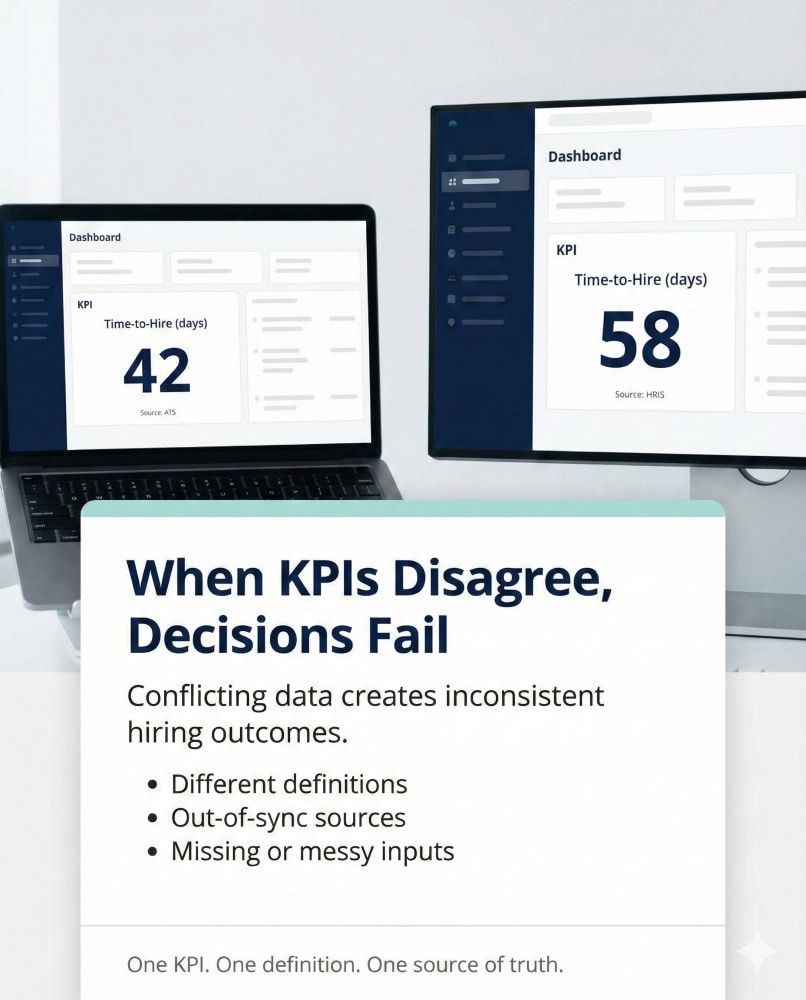
Data Quality: The Part That Quietly Ruins Everything
Data-driven decision making fails for one boring reason: the data is wrong, incomplete, or inconsistent. Then teams “trust the numbers” and confidently walk into a wall.
Data quality is not abstract. It is three basic questions:
- Accuracy: Is the data correct?
- Completeness: Is anything missing that would change the decision?
- Consistency: Are definitions and formats the same across sources and teams?
If any of those break, your “insights” become expensive fiction.
Common data quality failure modes
1) Definitions drift
One team counts “qualified candidate” as “meets minimum requirements.” Another counts it as “passed hiring manager screen.” Same label, different meaning, garbage comparison.
Fix: define key terms once, then enforce them in your CRM/ATS reporting.
2) Biased or unrepresentative data
Your dataset might over-represent certain regions, customer segments, or candidate profiles. Then the model, dashboard, or analysis learns the bias and calls it “truth.”
Fix: check what is missing, not just what is present. Segment results by region, role type, seniority, and channel before you generalize.
3) Messy inputs and manual fields
Free-text fields, inconsistent tagging, duplicates, and missing values do not just “average out.” They distort outcomes. Especially in hiring and sales ops, where humans enter data differently under pressure.
Fix: reduce free-text where it matters, standardize dropdowns, and run basic hygiene checks monthly.

Practical “good enough” data quality (without turning into a data warehouse project)
You do not need perfection. You need a minimum standard that matches the risk of the decision.
Use a simple rule:
- Low-risk decisions (small budget shifts, minor process tweaks): directional accuracy is fine.
- High-risk decisions (hiring, pricing, layoffs, major spend): require stricter validation and clearer definitions.
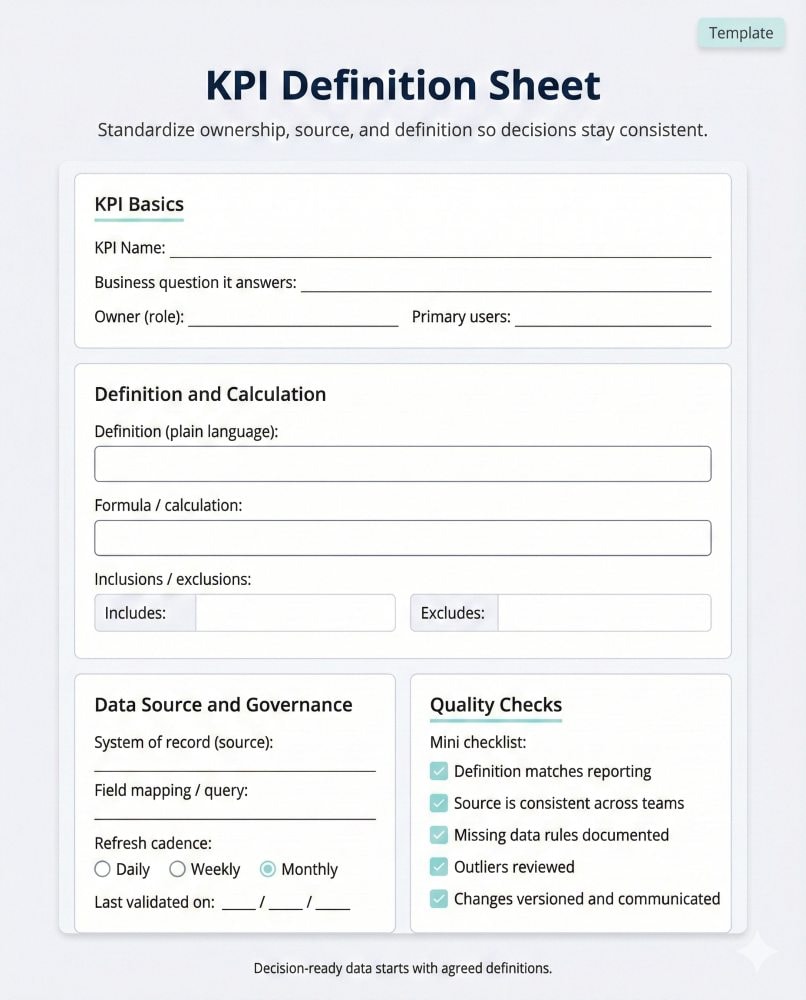
A useful habit is a one-page “data contract” for each key metric:
- what it means
- where it comes from
- who owns it
- how often it is reviewed
That single page prevents weeks of arguing and makes your decisions faster and harder to derail.
Creating a Data-Driven Culture
Building a data driven culture is essential for organizations that want to fully realize the benefits of data analytics and data analysis. This means creating an environment where data professionals and business teams work together to extract insights from raw data, visualize data effectively, and communicate findings clearly across the organization. A true data driven culture encourages everyone to use data to make informed decisions, moving away from assumptions and biases that can cloud judgment.
Ensuring data quality is a cornerstone of this culture—accurate, consistent, and reliable data is critical for sound decision making. By fostering collaboration and open communication, organizations can identify patterns and trends that inform strategic decisions and help them stay ahead of the competition. Adopting advanced tools like predictive analytics, machine learning, and prescriptive analytics further enables teams to anticipate future outcomes and make data driven decisions that support business growth.
When a data driven culture is in place, organizations are better equipped to respond to change, innovate, and achieve their business objectives through smarter, evidence-based strategies.
Examples of Using Data to Make Decisions (By Function)
This is the part people actually came for. Not another definition of “analytics.”
Marketing: spend, message, and audience decisions
Decision examples
- Shift budget from channels that drive clicks to channels that drive qualified leads.
- Choose which message wins based on conversion rate, not internal opinion.
- Identify which customer segments respond differently and stop treating everyone the same.
What data you use
Web analytics, campaign performance, attribution, landing-page conversion, cohort retention.
What “better outcome” looks like
Lower acquisition cost for the same quality, higher conversion rates, and fewer random “brand experiments.”

Sales: pipeline, pricing, and retention decisions
Decision examples
- Prioritize leads based on likelihood to close (not who shouted loudest).
- Adjust pricing packages based on win-loss patterns and churn signals.
- Spot renewal risk early using product usage and support ticket trends.
What data you use
CRM stages, win-loss notes, deal cycle length, discounting patterns, expansion and churn history.
What “better outcome” looks like
More accurate forecasts, higher close rates, cleaner handoffs, and fewer “surprise” lost deals.
Operations: inventory, staffing, and process bottlenecks
Decision examples
- Set reorder points using demand patterns instead of gut feel.
- Staff shifts based on volume by hour/day, not last month’s schedule template.
- Identify the one process step causing delays and fix that before “optimizing everything.”
What data you useOrder history, seasonality, supplier lead times, throughput rates, error rates, real-time traffic or demand signals.
Walmart uses big data analytics for inventory management, optimizing stock levels based on real-time data from its point of sale systems, weather forecasts, and social media trends. Smart city initiatives use real time traffic data to analyze traffic patterns, reduce congestion, and improve urban planning.
What “better outcome” looks like: Fewer stockouts, lower carrying costs, smoother delivery, higher operational efficiency.
Customer experience: what customers say vs what they do
Decision examples
- Fix the top two reasons for complaints based on ticket tagging and review themes.
- Improve onboarding based on drop-off points in product usage.
- Decide whether a policy change helps or hurts based on contact rate and satisfaction trends.
What data you use
Support tickets, call/chat logs, online reviews, NPS/CSAT, product usage events, churn reasons.
What “better outcome” looks like
Lower ticket volume for repeat issues, faster resolution, better retention.

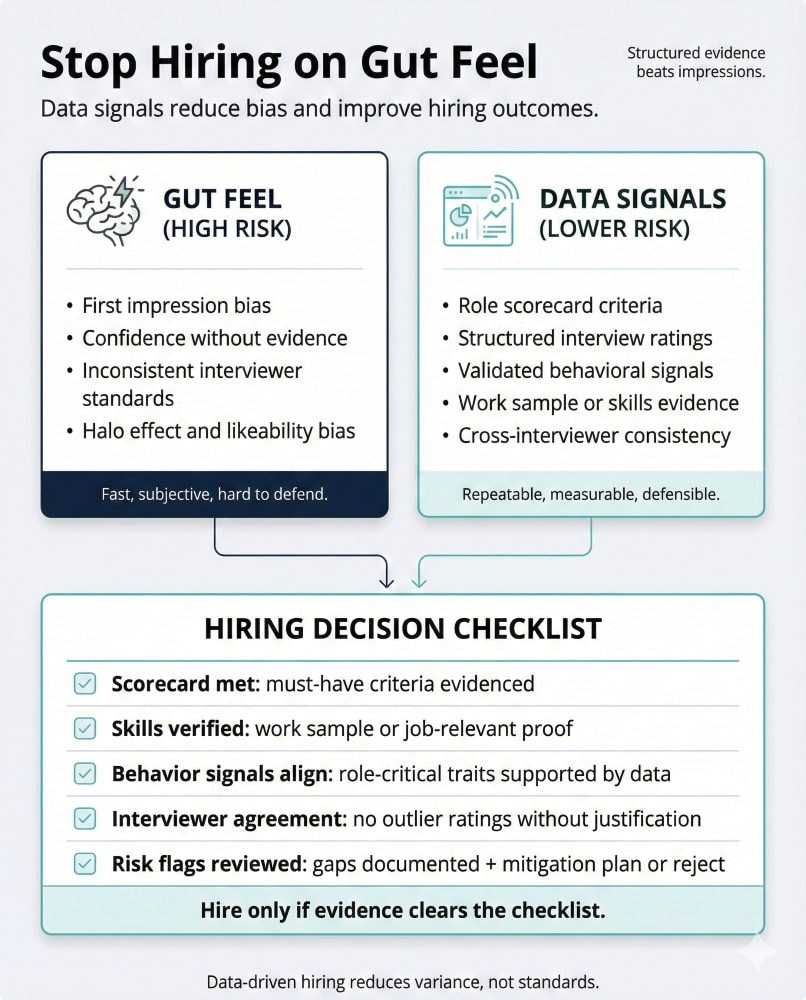
People and hiring: replacing “vibes” with structured signals
This is where data-driven decision making matters most because the cost of a wrong hire is not just financial. It drags performance, culture, and manager time.
Decision examples
- Standardize interview scoring so candidates are compared on the same criteria.
- Identify where good candidates drop out (application, screen, interview loop) and fix the step.
- Predict early turnover risk by combining structured role requirements, interview data, and validated assessments.
What data you useATS funnel metrics, structured interview scorecards, performance outcomes at 90/180 days, retention, hiring manager feedback. If you use assessments, they need to be validated and job-relevant.
Data scientists analyze qualitative data such as performance reviews and employee surveys to gain insights into management effectiveness and improve workplace practices. Organizations also analyze turnover and absenteeism metrics to develop targeted recruitment and retention strategies for employees.
What “better outcome” looks likeMore consistent hiring decisions, fewer bad surprises after 60–90 days, better role fit.
Soft reality check: “more interviews” is not a strategy. Better signals are.
Actionable Insights for Business Decisions
Actionable insights are the foundation of effective data driven decision making. By diving deep into large datasets—such as online reviews, customer behavior, and purchasing habits—organizations can extract relevant information that leads to more informed business decisions. Data analytics and data analysis transform raw data into valuable insights, revealing growth opportunities and helping businesses optimize operations.
These actionable insights enable companies to enhance customer experience, improve inventory management, and increase operational efficiency. For example, analyzing customer feedback can highlight areas for service improvement, while studying purchasing trends can inform product development and marketing strategies. In healthcare, data driven approaches can even help identify patients at risk, leading to better outcomes and resource allocation.
By leveraging data and fostering a data driven culture, organizations can make decisions that not only solve immediate problems but also drive long-term success and help achieve strategic goals. The ability to turn massive volumes of data into real, actionable insights is what sets leading businesses apart in today’s competitive environment.
How to Tell If It Worked (KPIs That Match the Decision)
If you do not measure outcomes, your “data-driven decision” is just a well-documented opinion.
The trick is to match the KPI to the decision, then define the review window before you act. Different decisions have different time horizons.
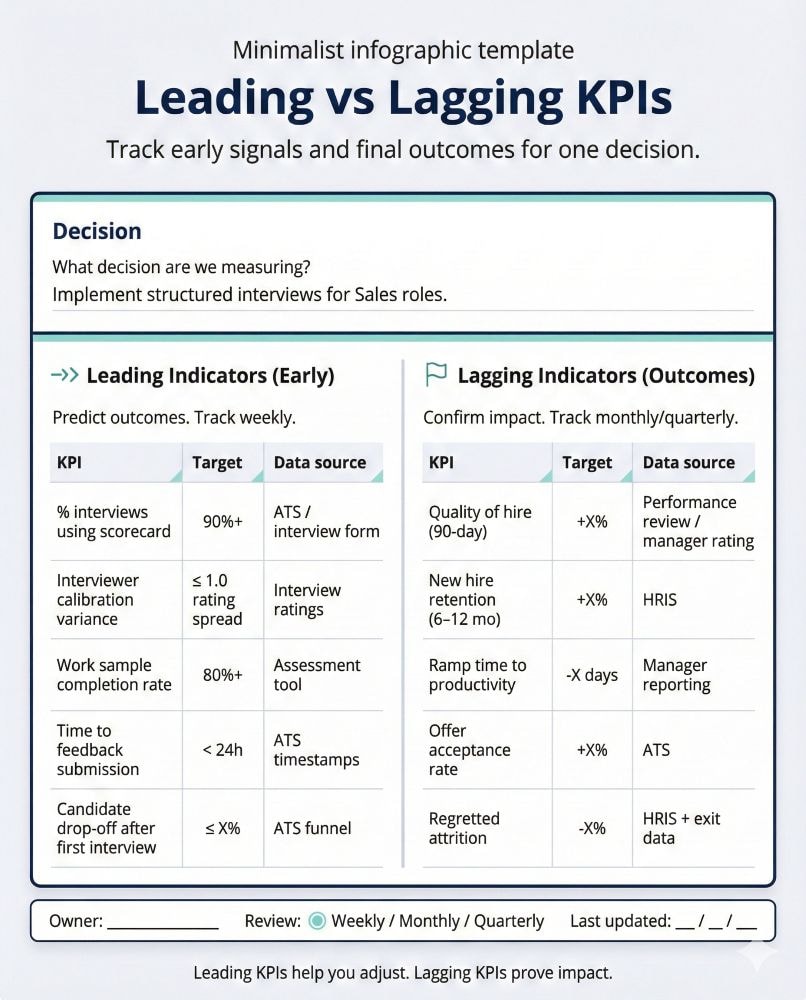
Choose KPIs that reflect the outcome, not activity
Activity metrics are tempting because they move fast. They are also great at lying.
- Activity: emails sent, interviews scheduled, tickets closed
- Outcome: revenue retained, quality of hire, customer churn, on-time delivery
Use activity metrics only as leading indicators, not the definition of success.
Use a baseline so you know what “better” means
Before you change anything, capture a baseline:
- last 4–12 weeks (fast-moving work)
- last quarter or year-over-year (seasonal businesses)
Then compare against it. Without a baseline, every result gets interpreted as a win.
Keep comparisons fair
If you can, compare:
- Before vs after (same team, same context)
- A vs B (two approaches running at once)
- Segmented outcomes (role type, region, customer segment)
This is how you avoid declaring victory because one month happened to be good.
Decide your review date in advance
Write it down: “We will review in 30/60/90 days.”
That prevents two bad habits:
- abandoning decisions too early because results did not show instantly
- keeping bad decisions too long because nobody wants to admit it
Example KPI matches (so it’s not abstract)
- Marketing channel shift: qualified leads, CAC, conversion to opportunity
- Sales lead scoring: close rate, cycle length, forecast accuracy
- Inventory change: stockouts, carrying cost, fulfillment time
- Support process fix: repeat ticket rate, resolution time, CSAT
- Hiring change: pass-through rates, time-to-fill, turnover at 90/180 days, hiring manager satisfaction
Pick 2–4 KPIs max per decision. More than that and you are back to dashboards as decoration.
FAQ: Examples of Using Data to Make Decisions
What is an example of using data to make a decision?
A simple example is reallocating budget based on results. If your marketing data shows Channel A drives lots of clicks but few qualified leads, and Channel B drives fewer clicks but more conversions, a data-driven decision is to move spend toward Channel B and measure the impact over the next 30–60 days.

What are examples of data-driven decision-making?
Common examples across business include:
- Using churn and product usage data to prioritize retention outreach.
- Using inventory and demand trends to set reorder points.
- Using pipeline conversion rates to fix the weakest sales stage.
- Using support ticket themes to remove the top causes of complaints.
- Using structured interview scorecards and validated assessments to improve hiring consistency.
How do you use data for decision-making?
Use a repeatable loop:
- define the decision
- choose 1–3 metrics that define success
- gather relevant data and check quality
- analyze for patterns and test assumptions
- decide, act, and set a review date with KPIs
This keeps analysis tied to outcomes instead of turning into reporting for its own sake.
Conclusion: Turning Data into Better Outcomes
Data does not replace judgment. It disciplines it.
When teams define decisions clearly, protect data quality, and measure outcomes with the right KPIs, they make fewer expensive mistakes and repeat what works. The competitive edge is not having more dashboards. It is having a decision process that improves over time.
If you want to see how OAD performs on your roles and candidates, test OAD for free and start building a hiring process that produces measurable, repeatable outcomes.