Internal benchmarking sounds simple: compare teams inside your own company, find what works, then scale it.
In HR, it usually fails for one boring reason: people compare the wrong things. Different roles. Different labor markets. Different managers. Different time windows. Then everyone argues about the “data” until the initiative quietly dies.
A better approach treats internal benchmarking as a controlled comparison. You define what “comparable” means, choose a small set of key performance indicators (KPIs), standardize data collection, and focus on actionable insights you can actually operationalize.
Table of Contents
- What is internal benchmarking in HR (and when should you use it)?
- Internal benchmarking process (step-by-step)
- What to benchmark: KPIs that drive business performance
- Data collection and quality: build a dataset you can trust
- How to compare data and identify performance gaps
- Turn benchmarking into action: best practices and action plans
- Continuous improvement: keep internal benchmarking from going stale
- Governance, ethics, and data privacy for behavioral benchmarking
- Tools and templates for effective internal benchmarking
- Quick start plan (30 days to baseline, 90 days to improvement)
- FAQ: Internal benchmarking in HR and people analytics
- Conclusion: Make smarter decisions with behavioral data and internal benchmarks
Data collection and quality: build a dataset you can trust
Internal benchmarking is the practice of comparing performance, processes, or outcomes across teams, departments, locations, or time periods within your own company.
In people analytics, internal performance benchmarking typically answers questions like:
- Which teams hire faster without sacrificing quality?
- Where do new hires ramp the quickest, and why?
- Which managers retain top performers longer?
- Where do you see early risk signals for turnover?
Internal benchmarking is most useful when you want to improve process efficiency and business performance without guessing. It helps you identify performance gaps based on evidence, not anecdotes, and create action plans that replicate proven practices. The benefits of internal benchmarking include improved communication between teams, greater efficiency, and facilitating change by making it easier to adopt successful processes across the organization.
It is also one of the few benchmarking methods that naturally fits HR’s reality: you can control definitions, data collection, and context far better inside your own company than you can when comparing to competitors.

Internal vs external benchmarking: the practical difference for HR
Internal benchmarking compares teams inside your organization. It is strongest for diagnosing “how” and “why” something works because you can examine workflows, manager practices, enablement, and behavioral patterns in context.
External benchmarking compares your company to other companies or industry benchmarks. It can be useful for sanity-checking targets, especially for broad metrics like time-to-fill or offer acceptance rate, but it often breaks down when you try to interpret causes.
In practice:
- Use internal benchmarking to find best practices, improve processes, and drive continuous improvement.
- Use external benchmarking selectively to validate whether your internal targets are realistic, given your market and talent pool.
If you force external comparisons into decisions that depend on role nuance, seniority, or leadership behavior, you get misleading “insights” that are basically expensive opinions.

When benchmarks mislead: common comparison traps (teams, roles, timeframes)
Internal benchmarking creates value only when the comparison is valid. Most organizations get tripped up by three predictable traps:
- Comparing non-comparable roles
Comparing SDR turnover to engineering turnover is not benchmarking. It is comparing different labor markets and work realities. - Ignoring time windows and seasonality
Hiring outcomes can shift by quarter, budget cycle, or business changes. If your “top performing teams” were measured during a calmer period, the benchmark is distorted. - Mixing process differences with performance differences
If one team has a structured hiring process and another relies on unstructured interviews, you are benchmarking two different systems. That’s fine, but name it. Otherwise you misattribute causality.
A clean benchmarking process starts by defining the comparison set: same role family, similar seniority, similar hiring volume, and a shared timeframe. This step is equally important as any other in the benchmarking process—if you cannot define that, you cannot interpret the gaps.
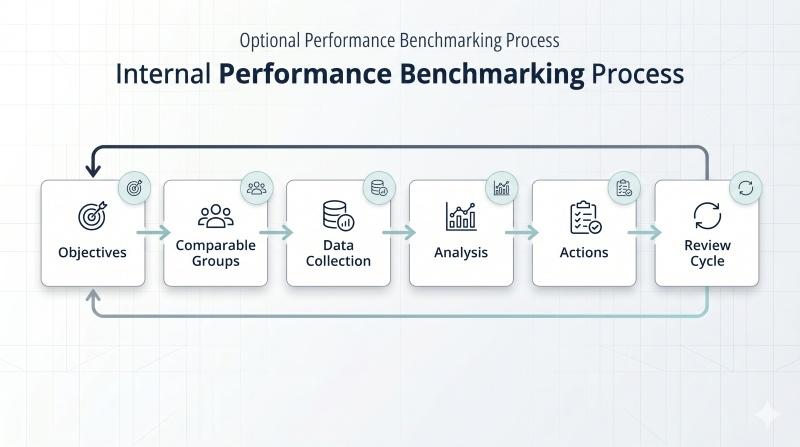
Internal benchmarking process (step-by-step)
Internal benchmarking works when you treat it like an operational process, not a reporting exercise. The goal is not a prettier dashboard. The goal is to change decisions and outcomes.
Here’s a practical benchmarking process that holds up in real organizations with messy data, political incentives, and limited time.
Define clear objectives tied to hiring, retention, and team alignment
Start by writing the decision you want to improve. Not the metric. The decision.
Examples that actually help:
- “Reduce regrettable turnover in the first 6 months for Sales Team A.”
- “Improve promotion fit for frontline managers.”
- “Increase quality of hire in a high-volume role without slowing the hiring process.”
Then translate the decision into measurable goals. Keep the list short. If you track 25 things, you will improve none of them. Setting clear, measurable goals that align with your organization’s priorities is essential for effective internal benchmarking.
Good internal benchmarking objectives share three traits:
- They are tied to business performance (output, quality, retention, customer satisfaction).
- They can be influenced by HR and leaders within a quarter or two.
- They can be measured consistently across teams.
This is where behavioral data earns its keep. If your objective includes “team alignment” or “manager effectiveness,” you need consistent measures that go beyond engagement surveys and manager opinions, such as a clinically validated personality assessment like the OAD Survey.

Map comparable teams, roles, and timeframes for valid comparisons
Benchmarking is comparison. Comparison requires similarity.
Create your comparison map before you look at results. To ensure valid internal benchmarking, determine the key factors or metrics that will be compared across teams or roles. Otherwise you will “discover” whatever your favorite narrative needs.
Minimum comparison rules for internal performance benchmarking:
- Role comparability: same role family and level (or clearly defined adjacent levels).
- Volume comparability: similar hiring volume or team size, so one outlier hire does not skew results.
- Context comparability: similar region/labor market when relevant.
- Timeframe comparability: the same measurement window for all groups.
A practical pattern is to benchmark within a role family first, then expand:
- One role family (high-volume or high-impact)
- One region or business unit
- One quarter or half-year window
You can still benchmark across departments, but do it with constraints. “Sales vs Engineering” is usually not a KPI discussion. It’s a business model discussion.
Secure leadership sponsorship and cross-functional participation early
Internal benchmarking touches power. It creates winners and losers, even if you swear it won’t.
If you do not get leadership sponsorship and clear guardrails up front, the project will die the moment results challenge someone’s identity as a “high performer.” It’s essential to bring together the right team to lead the benchmarking initiative, ensuring guidance and direction throughout the process.
Do three things early:
- Name the purpose: continuous improvement, not ranking managers.
- Define participation: HR, analytics, and key business leaders agree on scope and KPIs.
- Set governance: who can access what, what gets reported, and how insights will be used.
Cross-functional participation matters because HR rarely owns all inputs. Hiring process steps, onboarding, enablement, manager routines, and workload design often sit outside HR. You need access and collaboration, not permission slips. To achieve success in internal benchmarking, organizations need to focus on leadership support, clear communication across departments, and active participation from staff, especially for founders and CEOs who are building teams for long-term strategic fit.

What to benchmark: KPIs that drive business performance
If you pick the wrong KPIs, you can run the entire benchmarking process flawlessly and still end up with useless conclusions. HR teams often default to what’s easy to extract from HRIS, not what predicts outcomes.
Benchmark fewer things. Benchmark the right things. Tie them to decisions leaders actually make.
Select key performance indicators tied to role-fit, performance, and retention
Start with outcome KPIs. These anchor the benchmarking process to business performance instead of HR activity. Selecting the right KPIs is crucial for effective internal benchmarking, as they should align with strategic goals and provide actionable insights.
Common outcome KPIs that work globally and travel well across functions:
- Quality of hire (define it plainly: performance rating at 6–12 months, ramp time, output targets hit)
- Regrettable turnover (especially in first 6–12 months)
- Time to productivity (ramp time, time to first quota, time to independent delivery)
- Internal mobility success (promotion fit, transfer success, time-to-proficiency post-move)
- Manager effectiveness proxies (team retention, performance distribution stability, engagement trends), which matter enormously when you build winning sales teams and promote the right reps into leadership
- Profitability (measuring how talent decisions impact financial performance)
Common KPIs for internal benchmarking also include efficiency, cost control, quality, and productivity, which help organizations identify performance gaps and areas for improvement.
Then add a small set of process KPIs if they are directly connected to outcomes:
- Time-to-fill (only matters if quality holds)
- Offer acceptance rate (matters if you’re losing the right candidates)
- Interview-to-offer ratio (matters if your funnel is broken)
Avoid benchmarking vanity metrics. If the KPI can be “improved” by changing how you measure it, it’s not a KPI. It’s a hobby.
Behavioral KPIs: what to include (and what to avoid)
Behavioral data can sharpen internal benchmarking because it gives you consistent measures across teams. But it can also create chaos if you treat personality outputs like a horoscope.
Use behavioral KPIs when they meet two conditions:
- They are measured with a validated methodology (consistent administration, reliable scoring).
- They link to a real outcome you care about (performance, retention, team fit, customer satisfaction, process efficiency).
Useful behavioral KPIs in an HR benchmarking context, especially when powered by behavior fit reports that match roles to personality:
- Role-fit indicators (how well candidates align with the behavioral demands of the role), reinforced by behavioral interview questions that assess cultural fit
- Communication style patterns (relevant for leadership, client-facing roles, or cross-functional work, and easier to quantify when you use structured strategies to assess communication skills in interviews)
- Motivator alignment (predicts engagement and retention risk when misaligned, especially when you have motivation insights into what truly drives your hires)
- Risk signals (burnout risk patterns, conflict triggers, low structure tolerance in high-process roles) that can be surfaced through risk alerts predicting turnover and team fit issues
What to avoid:
- Turning behavioral benchmarks into “ideal personality types”
- Using behavioral profiles as a reason to reject candidates without structured job relevance
- Publishing team-level behavioral comparisons that can be reverse-engineered to individuals
Behavioral benchmarking should improve systems: selection, onboarding, manager practices, and team design. It should not become a status symbol, and it works best when anchored in psychometrically precise tools like the OAD Survey.

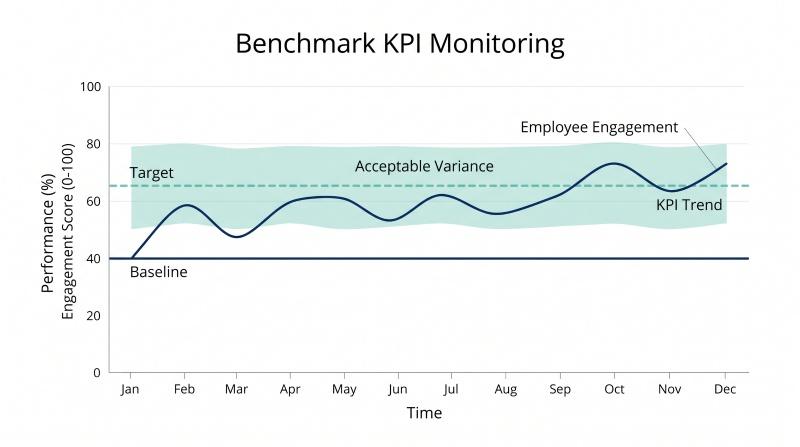
Set baselines, targets, and acceptable variance
Most teams skip this step, then argue forever about what “good” means.
Set three things per KPI:
- Baseline: current performance level (last quarter or last 6–12 months, depending on volume)
- Target: improvement goal that is realistic given constraints
- Acceptable variance: range that is normal noise vs a signal worth action
If you have enough volume, use internal distribution to set targets. For example, define “top performing teams” as the top quartile for quality of hire and retention, not as whoever shouts loudest in meetings.
If you don’t have volume, keep targets directional and focus on process improvements and leading indicators.
This is also where external benchmarking can help, lightly. Use it to sanity-check whether your internal targets are plausible for your labor market and company size. Do not use it to override what your internal data clearly shows.
Data collection and quality: build a dataset you can trust
Internal benchmarking collapses the moment people suspect the inputs are inconsistent. Not because they love data integrity, but because “your data is wrong” is the easiest way to dodge uncomfortable conclusions.
So you make the boring part non-negotiable: consistent definitions, consistent administration, and clean data collection.
Standardize data collection across locations and teams
If different teams collect data differently, your benchmarks are measuring process differences in data entry, not differences in business performance.
Standardize these elements:
- Who is included: employees, candidates, contractors, specific role families
- When measurement starts: offer accepted, start date, day 30, day 90
- How outcomes are defined: what counts as “regrettable turnover,” what counts as “productive”
- How assessments are administered: same instructions, timing, and context
For behavioral data, consistency matters even more. If one region administers an assessment as part of a structured hiring workflow and another does it ad hoc, you’re not comparing teams. You’re comparing methodology.
This is also where transparency matters. Managers need to know what the benchmarking is for, how results will be used, and what it is not used for. If they assume it’s a surveillance tool, they will sabotage participation.
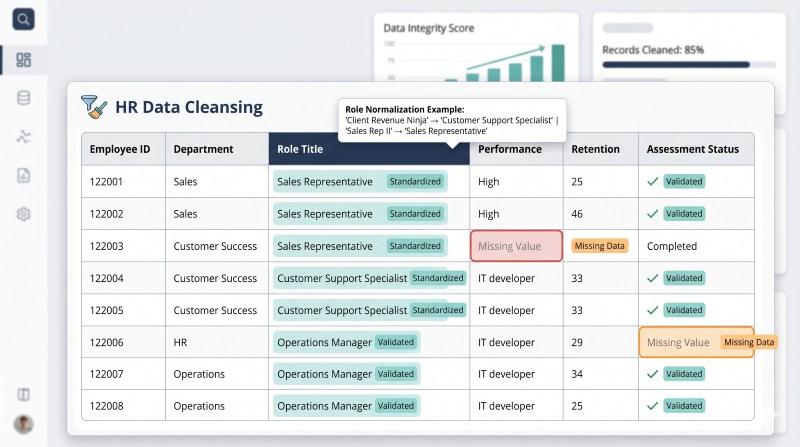
Clean HRIS and assessment data before analysis
Before you compare data, you remove the predictable distortions:
- Duplicate employee records
- Missing or inconsistent role titles and levels
- Misaligned department mappings after reorganizations
- Incorrect termination reasons
- Manager-of-record errors during transitions
- Assessment records that are incomplete or taken outside the intended window
If you can’t clean everything, at least label it. A flagged dataset beats a “clean” dataset built on wishful thinking.
A practical rule: if a KPI relies on fields that are inconsistently populated, do not benchmark it yet. Fix the data collection first or choose a KPI that’s measurable now.
Ensure consistent timestamps and definitions for trend tracking
Benchmarking is not just comparing teams. It’s comparing time periods, too.
To do that, you need consistent timestamps:
- Candidate stage dates (screen, interview, offer, start)
- Assessment completion date
- Performance review period date
- Promotion or role change effective date
- Termination date and reason code
Then enforce definitions:
- What is “time to productivity” for this role?
- What is “quality of hire” and when is it measured?
- What counts as “high performance” in this cohort?
If those definitions shift quarter to quarter, you can’t evaluate continuous improvement. You can only generate noise.
How to compare data and identify performance gaps
This is the part where benchmarking turns into either useful decisions or a politics festival.
The goal is not to “prove” a team is better. The goal is to identify performance gaps you can explain and reduce. Internal benchmarking allows for efficient sharing of knowledge and rapid identification of bottlenecks without expensive external consulting, making the process more efficient and focused on operational improvement.

Compare by role, tenure, and performance cohort
If you compare everyone to everyone, you learn nothing. Segment first, then compare.
Strong segmentation patterns in HR benchmarking:
- By role family and level: same job, same expectations
- By tenure band: 0–90 days, 3–6 months, 6–12 months, 12+ months
- By performance cohort: top performers vs average vs struggling (based on defined criteria)
- By manager cohort: not to rank managers, but to detect scalable practices
A practical approach is to pick one primary slice per KPI. Example:
- Retention KPI: compare teams within the same role family for the 0–6 month tenure band.
- Quality of hire KPI: compare 6–12 month performance outcomes for hires made in the same quarter.
This is where “internal benchmarking” becomes “effective internal benchmarking.” You stop chasing broad averages and start comparing processes that can actually be improved.
Identify meaningful gaps without overclaiming statistical certainty
Most HR teams swing between two extremes:
- Overconfident conclusions based on tiny samples.
- Paralysis because they think everything needs PhD-level certainty.
You can stay sane with a few rules:
- Check sample size before you interpret differences
If Team A had 8 hires and Team B had 60, don’t pretend the comparison is equal. - Look for consistent patterns across time
A one-quarter spike might be noise. A repeated pattern across two or three periods is a signal. - Use “directional + actionable” when precision is not possible
You can say: “This team’s early turnover is consistently higher.”
You should not say: “This manager causes turnover.” That’s a lawsuit-shaped sentence.
If you have enough volume, use basic significance testing or confidence intervals. If you don’t, use stability over time and triangulation with qualitative inputs (manager routines, onboarding differences, workload design).
Benchmarks are decision tools, not courtroom evidence.
Visualize findings clearly for leaders and managers
The fastest way to kill internal benchmarking is to present results like a research paper.
Use simple visuals:
- Bar charts for team comparisons (with clear labels)
- Trend lines for progress over time
- Heatmaps for multi-team scanning (sparingly)
- A single “gap summary” table with definitions
And always include:
- The comparison filter (role, level, timeframe)
- The KPI definition
- The sample size
- The action hypothesis (what you think explains the gap)
If leaders can’t tell what they’re looking at in 15 seconds, you’ve built a report, not a decision asset.
Turn benchmarking into action: best practices and action plans
This is where most internal benchmarking dies. Teams identify performance gaps, publish a slide deck, and then everyone goes back to doing the same thing with slightly more resentment.
Benchmarking only matters if you translate it into new practices, develop action plans and methodologies to implement best practices, run controlled changes, and keep what works. By identifying and adopting best practices through internal benchmarking, organizations can gain significant improvements in efficiency and performance.
After piloting and scaling new practices, employees are more likely to adopt best practices when they see them working inside their own company.
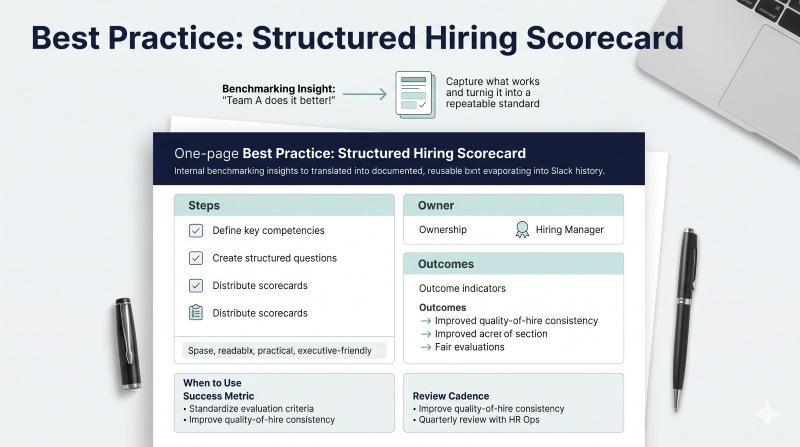
Document what top-performing teams do differently (process + behavior)
When a team outperforms, you document two categories:
1) Process practices (what they do)
Examples:
- Structured interview scorecards and decision rules
- Faster feedback loops during hiring
- Onboarding sequences that reduce ramp time
- Clear role expectations in the first 30 days
2) Behavioral patterns (how work gets done)
Examples:
- Manager communication cadence and feedback style
- Team norms around accountability and conflict
- Motivator alignment between role design and what people actually value
- Predictable risk signals that show up before turnover that can be sharpened through behavioral tools built for coaching leaders with data
This is where people analytics and behavioral data can add real clarity. Instead of “they have a better culture,” you can say: “They set expectations earlier, use consistent selection criteria, and reinforce the same behaviors during onboarding.”
Keep documentation short. One page per best practice is enough. If it needs 12 pages, it’s not a practice. It’s a novel.
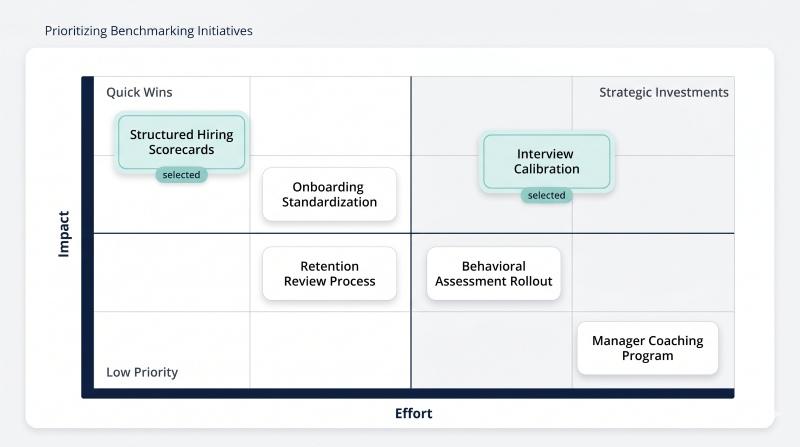
Prioritize actions by impact vs effort and assign owners
Not every gap deserves a program. Some gaps exist because the business context is different and that’s fine.
Prioritize with a simple grid:
- High impact / low effort: do now
- High impact / high effort: plan, resource, phase
- Low impact / low effort: optional
- Low impact / high effort: don’t touch it
Then assign owners. “HR will handle it” is not ownership. It’s a way to ensure nothing changes.
Good action plans include:
- A single accountable owner (not a committee)
- Milestones with dates
- Required resources (people, budget, tools)
- A measurable goal tied to the KPI
Pilot changes, measure results, then scale what works
If you roll out changes company-wide immediately, you’ll never know whether the change caused improvement or whether you just got lucky.
Run a pilot:
- Choose one team or region with enough volume to measure change
- Define what will change (specific behaviors, steps, tools)
- Define success metrics before you start
- Run for a set period (usually 6–12 weeks depending on cycle time)
- Review results, then decide: scale, iterate, or stop
This is continuous improvement in practice. You keep the benchmarking process alive by making it part of how the organization learns.
Continuous improvement: keep internal benchmarking from going stale
Benchmarking is not a one-time audit. If you only do it once, you end up memorializing last year’s reality and calling it strategy.
A useful internal benchmarking process has a cadence, owners, and a way to refresh what “good” looks like as the company changes.
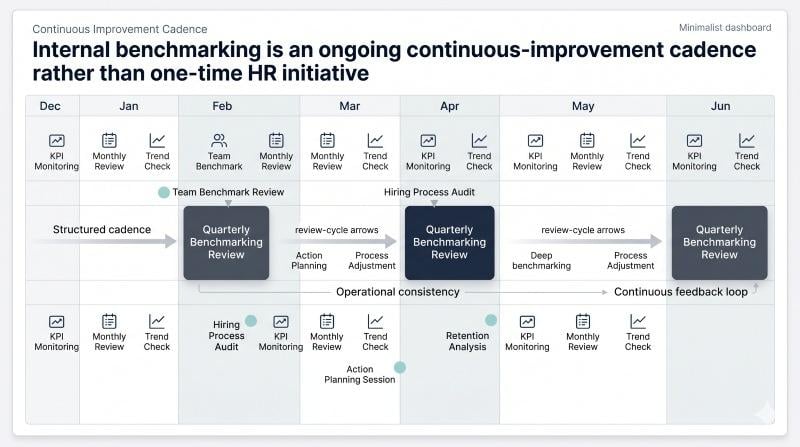
Monitor KPIs monthly, review quarterly, and refresh targets
Use two rhythms:
- Monthly: lightweight monitoring of key performance indicators
Goal: catch drift early (performance gaps widening, turnover risk rising, process efficiency dropping) - Quarterly: deeper review and interpretation
Goal: identify root causes, update action plans, and decide what to scale
Targets should not be permanent. A target that made sense at 80 employees may be meaningless at 800.
Refresh targets when:
- role requirements shift (new tools, new workflows)
- labor market conditions change
- your hiring bar changes
- manager capability changes (new leaders, restructures)
This is where internal benchmarking outperforms external benchmarking. You can adapt benchmarks to your own company’s operating reality instead of chasing someone else’s.
Capture lessons learned and update playbooks over time
If you run pilots but never capture lessons learned, you’re doing expensive improv.
After each pilot or rollout, document:
- what changed (specific practices)
- what improved (metrics, direction, magnitude)
- what did not improve (and why you think that happened)
- what should be repeated, modified, or retired
Then update the playbooks. Benchmarking becomes scalable when best practices stop living in one manager’s head and start living in your operating system.
If you want internal benchmarking to drive continual growth, treat it like a product:
- version it
- iterate it
- retire what fails
- keep what works
Governance, ethics, and data privacy for behavioral benchmarking
If you’re benchmarking behavioral data without governance, you’re not “data-driven.” You’re just collecting liabilities in a spreadsheet.
The point of governance is simple: protect people, protect trust, and keep the benchmarking process focused on system improvement.
Informed consent and appropriate use of behavioral data
Behavioral data is not the same as performance data. It’s more personal, more easily misused, and more likely to trigger employee pushback if you’re sloppy.
Baseline rules that hold up globally (and keep you out of unnecessary trouble):
- Be explicit about purpose: what the data is used for (benchmarking processes and outcomes) and what it is not used for (punitive ranking, discrimination, gossip).
- Collect consent where required and document it: especially when behavioral assessments are used beyond hiring into internal mobility, development, or retention programs.
- Limit access: only people who need the data for defined decisions should see it.
Even in places where consent is not strictly mandated for every use case, treating it as a best practice is how you avoid “HR surveillance” narratives that kill adoption.

Anonymize reporting and protect individual identities
Internal benchmarking is about comparing teams and processes. It is not about naming individuals.
Protect identities by default:
- Report at team or cohort level (with minimum group sizes)
- Avoid “small cell” reporting where one person can be inferred
- Use aggregation and suppression rules (for example, do not show breakdowns under a minimum headcount threshold)
- Separate diagnostic dashboards from leadership summaries so managers don’t go fishing for “who is the problem”
If leaders ask for individual-level benchmarking, the right response is: “That’s performance management, not benchmarking. Different goal, different controls.”
Prevent misuse: benchmarking is for systems improvement, not blame
Benchmarking can turn toxic if it becomes a ranking contest. You avoid that by designing the program around improvement loops:
- Compare to learn, not to shame
- Diagnose the system: hiring process, onboarding, enablement, manager routines
- Focus on replicable practices, not personality judgments
- Treat gaps as hypotheses, not verdicts
A simple governance line that works in real life:
If a manager cannot take action on a result without naming an individual, it does not belong in the benchmarking report.
That keeps the benchmarking process aligned with continuous improvement and protects internal collaboration instead of undermining it.

Tools and templates for effective internal benchmarking
Humanity loves two things: collecting data and refusing to use it. Tools and templates are how you force the second part to be less inevitable.
The point is not “advanced analytics tools.” The point is repeatable decision-making. Effective internal benchmarking fosters a culture of continuous improvement and knowledge sharing across different departments within an organization, enabling teams to share expertise, best practices, and organizational learning.
Dashboards linking assessments to outcomes (actionable insights)
A useful benchmarking dashboard does three jobs:
- Shows outcomes clearly
Quality of hire, retention, time to productivity, promotion success. - Connects outcomes to inputs
Hiring funnel steps, onboarding completion, manager cadence, behavioral indicators that are job-relevant. - Points to action
Not “Team B is worse.” Instead: “Team B has longer ramp time. Their onboarding sequence differs in steps 2–3. Pilot Team A’s onboarding for 60 days.”
Minimum dashboard views that tend to work in 50+ employee companies, especially when backed by scalable pricing plans that fit different team sizes:
- Team comparison view: same role, same timeframe, key performance indicators side-by-side
- Trend view: baseline vs target over time
- Cohort view: results by tenure band (0–90, 3–6 months, 6–12 months)
If you’re using behavioral data, keep the display disciplined. Show only indicators that map to role requirements and business outcomes. Everything else belongs in the “interesting but irrelevant” bin. Dashboards are most useful when they’re fed by secure, individual application access for every employee instead of ad hoc links and scattered reports.

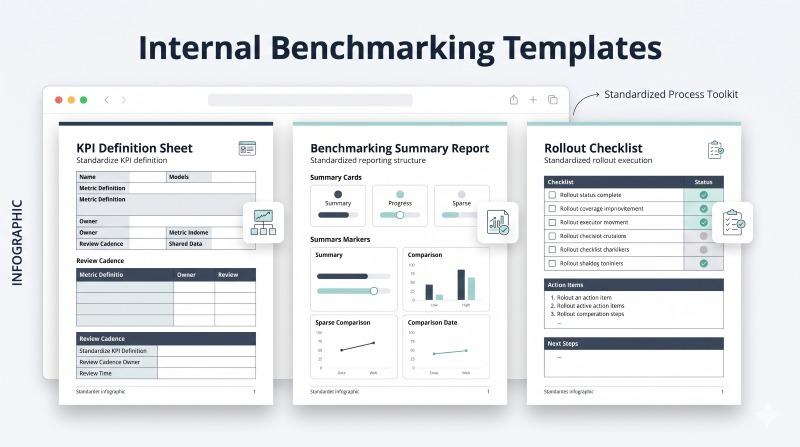
KPI definitions, reporting templates, and rollout checklist
You need three templates if you want this to scale beyond one analyst.
1) KPI definition sheet (one page)
Include:
- KPI name and business meaning
- Formula and data sources
- Inclusion rules (who counts, who doesn’t)
- Update cadence
- Known limitations
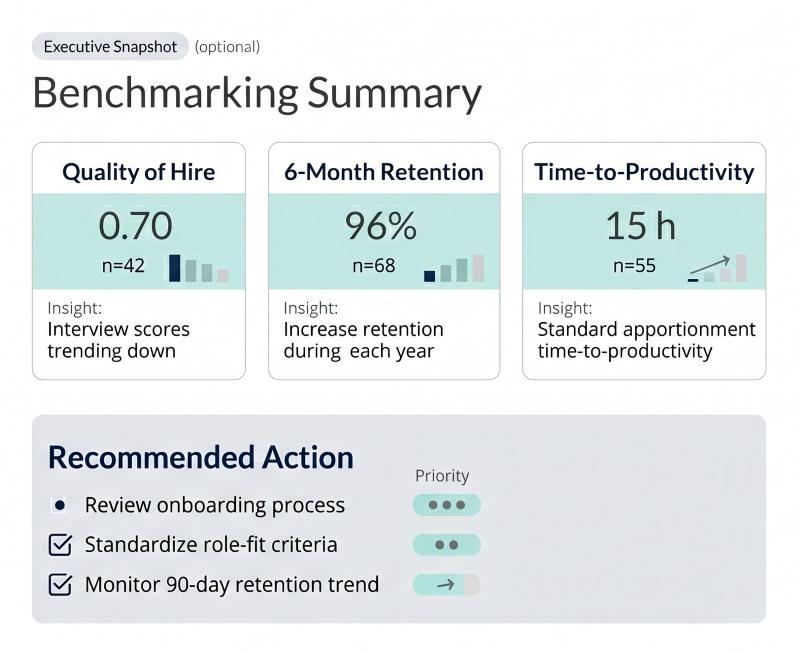
2) Benchmarking report template (one page executive summary + appendix)
Executive summary should include:
- What was compared (role, timeframe, cohorts)
- What changed (top gaps, trends)
- What to do next (action plan owners + milestones)
Appendix can include detailed charts and methodology.
3) Rollout checklist (keeps the process consistent)
Include:
- Clear objectives and scope
- Stakeholders and sponsorship
- Data collection readiness
- Privacy rules and access controls
- Communication plan for managers
- Pilot plan and success metrics
This is the unsexy part that prevents “benchmarking” from turning into random reporting with a fancy name.
Where advanced analytics tools help (and where they’re unnecessary)
Advanced analytics tools can help when you’re dealing with:
- Large datasets across many departments and regions
- Complex relationships (multiple factors affecting retention or performance)
- Predictive modeling for turnover risk or performance likelihood
- Automated data collection and governance workflows
They are unnecessary when you haven’t done the basics, whether you’re a single business unit or a complex portfolio such as a private equity-backed organization optimizing hiring strategy and ROI:
- consistent KPI definitions
- clean data collection
- valid comparison groups
- action plans with owners
If your dataset is small or inconsistent, “advanced analytics” mostly produces confident nonsense. Do the simple benchmarking process first, then upgrade your tooling once you’ve proven you can turn insights into improvement.
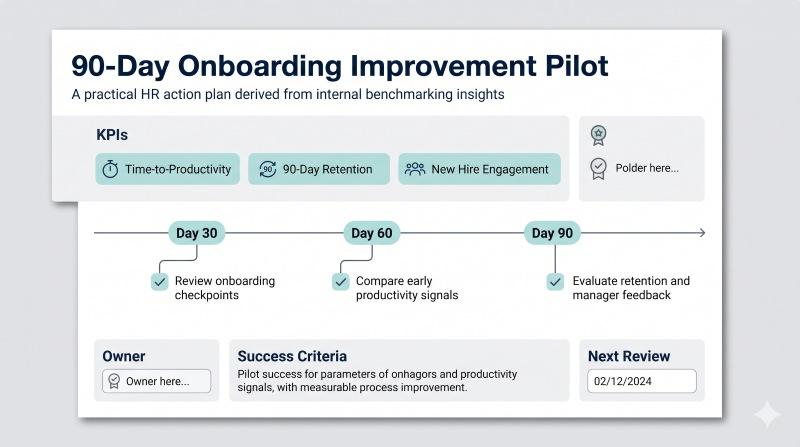
Quick start plan (30 days to baseline, 90 days to improvement)
You don’t need a year-long program to start internal benchmarking. You need a baseline, a valid comparison, and one pilot you can measure.
First 30 days: baseline data + consistent measurement
Week 1–2:
- Define clear objectives (one role family first)
- Choose 5–8 KPIs max
- Map comparable teams and timeframes
- Lock KPI definitions and data sources
Week 3–4:
- Standardize data collection and assessment administration
- Clean key HRIS fields (role, level, manager, dates)
- Build the baseline dashboard and first comparison view
- Share the first benchmarking snapshot with leaders (with guardrails)
Deliverable: a baseline that leaders trust enough to act on.
Next 60–90 days: targeted pilots + measurable goals
Days 30–45:
- Identify the 1–2 highest-value performance gaps
- Document top-performing team practices
- Select one pilot intervention with a clear owner
Days 45–90:
- Run the pilot
- Monitor KPIs monthly
- Capture lessons learned
- Decide: scale, iterate, or stop
Deliverable: one validated improvement with a playbook you can reuse.
FAQ: Internal benchmarking in HR and people analytics
[Image: HR manager reviewing an FAQ-style internal benchmarking guide on a laptop with a benchmarking dashboard in the background. Alt: “Internal benchmarking FAQ for HR leaders using people analytics”]
What is an example of internal benchmarking in HR?
Example: You compare 6-month retention and time to productivity for the same role (say, Customer Success Manager) across three regions. You find Region A has consistently faster ramp times and lower early turnover.
Then you document what Region A does differently (onboarding sequence, manager cadence, role clarity, behavioral role-fit thresholds), pilot those practices in Region B, and measure whether the KPIs improve.
How do you choose the right KPIs for benchmarking?
Use KPIs that meet three criteria:
- Decision-linked: the KPI influences a real decision (hiring, promotion, onboarding, retention intervention)
- Outcome-first: it reflects business performance, not HR activity
- Measurable consistently: definitions and data collection are stable across teams
A good KPI set usually includes a small number of outcomes (quality of hire, retention, time to productivity) plus a few leading indicators that explain movement (process steps completed, assessment-based role-fit signals).
How do you ensure comparisons are fair across departments?
Fair benchmarking starts with comparability rules:
- benchmark within the same role family and level
- align timeframes (same quarter or half-year)
- control for tenure bands
- avoid small-sample comparisons that overreact to outliers
If you must compare across departments, do it at a higher level (like onboarding completion rate) and avoid pretending it explains performance differences by itself.
How do you benchmark performance without harming trust?
You design the program around systems improvement:
- anonymize reporting at team/cohort level
- set minimum cohort sizes to prevent identity inference
- communicate purpose clearly: improvement, not ranking
- restrict access to sensitive behavioral data
- separate benchmarking from performance management processes
Trust dies when employees think benchmarks exist to label people. Trust survives when benchmarks exist to fix workflows, selection methods, onboarding, and manager support.
Is internal benchmarking the same as performance management?
No.
- Internal benchmarking compares teams and processes to identify what works and where performance gaps exist.
- Performance management evaluates individuals for compensation, promotion, and accountability.
They can use some of the same data, but the purpose, governance, and reporting should be different. Mixing them usually poisons both.
Conclusion: Make smarter decisions with behavioral data and internal benchmarks
Internal benchmarking is one of the few HR methods that can reliably drive continuous improvement, because it turns your own company into the reference set.
Do it well and you get:
- clearer performance gaps you can actually explain
- best practices you can scale across teams
- action plans tied to measurable goals
- better hiring, promotion, and retention decisions based on evidence
Do it poorly and you get dashboards that nobody trusts and meetings where everyone argues about definitions.
The difference is discipline: comparable groups, clean data collection, practical KPIs, and pilots with owners.
If you want to compare hiring, promotion, and retention outcomes with data instead of gut feel, test OAD for free and use the results to run internal benchmarking that actually changes overall performance.