A team effectiveness survey is one of the fastest ways to see how well a team is functioning, without relying on gut feel, hallway gossip, or whatever the loudest person in the room claims is “the real issue.” Done well, it gives leaders a clear view of what is helping or blocking results, and where to focus improvements.
This guide shows what to measure, how to design team effectiveness survey questions, how to run the survey without biasing responses, and how to turn survey results into specific actions that improve delivery, collaboration, and retention.
Table of Contents
- What is a team effectiveness survey?
- Why team effectiveness matters for organizational success
- Research basis: what “effective teams” consistently have in common
- What to measure in a team effectiveness survey (6 dimensions)
- Team effectiveness survey questions: design principles and examples
- How to run the survey (format, anonymity, cadence)
- How to analyze survey results and improve team effectiveness
- When to use it and how to roll it out (pilot to scale)
- FAQ: Team effectiveness survey
- Conclusion: a practical way to improve team effectiveness
What is a team effectiveness survey?
A team effectiveness survey is a structured questionnaire that measures the conditions that predict whether a team can consistently deliver high quality work. It focuses on team-level dynamics, not individual personality quirks or one-off performance issues.
A good survey makes “team effectiveness” measurable across the entire team, so leaders can answer three practical questions:
- Where is the team strong right now? (team strengths worth protecting)
- Where is the team stuck? (specific barriers, not vague “communication” complaints)
- What should we change first to improve team effectiveness? (priorities with the biggest impact)
Purpose: why organizations use a team effectiveness survey
Organizations use an effectiveness survey to make team performance visible and comparable, especially when teams are distributed, cross-functional, or scaling quickly. The goal is not to score teams like a school exam. The goal is to uncover the drivers that determine whether teams:
- understand the team goal and priorities
- collaborate effectively across roles and functions
- make decisions without friction and rework
- speak up early when risks appear (psychological safety)
- execute reliably, not just “work hard”
This is also where a team effectiveness survey differs from a generic engagement survey. Engagement is about how people feel at work. Team effectiveness is about whether the system the team works in lets them deliver.

What outcomes to expect
If you run the survey consistently and act on it, you should expect outcomes that matter at the organizational level:
- clearer alignment on objectives and priorities
- fewer execution breakdowns caused by unclear ownership
- better collaboration and faster decisions
- more consistent delivery quality across teams
- earlier detection of team risks (before they become turnover or project failure)
The survey also creates a common language for managers and team members. Instead of debating feelings, the team can discuss specific aspects of work: clear goals, decision making process, accountability, and team dynamics that support performance.
Why team effectiveness matters for organizational success
“Team effectiveness” sounds soft until you price the consequences of weak team performance: missed deadlines, rework, quality defects, slow decisions, and preventable turnover. In companies with 50+ employees, those costs compound because dependencies stack across teams.
A team effectiveness survey helps you reduce that risk by making the drivers of performance measurable, then manageable.
Business risks of weak team performance (quality, speed, retention)
Most performance problems blamed on “people” are actually system problems at the team level:
- Unclear priorities create busywork and constant resets.
- Slow or politicized decision making blocks execution and innovation.
- Low trust forces work into private channels and escalations.
- Low psychological safety delays bad news until it becomes expensive.
McKinsey’s research on team effectiveness links core team conditions to measurable outcomes. For example, they report that teams scoring above average on decision making were 2.8x more innovative, and teams scoring above average on trust were 3.3x more efficient and 5.1x more likely to produce results than below-average teams.
How effective teams drive innovation and continuous improvement
Innovation is not a motivational quote. It is a byproduct of how teams work:
- Teams surface issues early (psychological safety).
- Teams can disagree without spiraling (healthy conflict).
- Teams can decide and move (clear decision rights).
- Teams learn from outcomes (continuous improvement loop).
Psychological safety is especially important when conditions are unstable. A large study of 27,000 healthcare workers found that higher psychological safety was associated with lower burnout and higher intent to stay, even under severe constraints.
Team effectiveness vs individual performance: what leaders confuse
Leaders often try to “fix” delivery problems by coaching individual members harder. That can help at the margin, but it misses the bigger levers.
A team can have strong individual contributors and still fail if the team’s capacity is blocked by:
- unclear goals
- unclear ownership
- weak collaboration norms
- inconsistent leadership behaviors
- poor feedback loops
This is why a team effectiveness survey is useful: it isolates team-level drivers that predict whether the team delivers, not just whether individuals are talented.
Research basis: what “effective teams” consistently have in common
A good team effectiveness survey is not a vibes questionnaire. It’s a practical way to measure the team conditions that repeatedly show up in research on team performance: trust, clarity, decision quality, and the ability to speak up early when something is off.
Two notes that keep this grounded:
- Most “team models” overlap more than they differ. Different labels, same drivers.
- The goal is not to diagnose personalities. The goal is to identify which team conditions are blocking results.
Proven team dynamics models (brief, practical framing)
Most validated team effectiveness work converges on a small set of core drivers. For example, McKinsey’s team research highlights trust and decision effectiveness as measurable differentiators between teams that deliver and teams that stall. They report that teams scoring above average on trust were 3.3x more efficient and 5.1x more likely to produce results, and teams above average on decision making were 2.8x more innovative.
Psychological safety shows up as a separate but related driver: it influences whether teams surface risks early, challenge weak assumptions, and learn fast. That matters in stable operations, and it matters even more during change.
What “scientifically validated” should mean in practice
In HR, “validated” gets thrown around like confetti. For a team effectiveness survey, treat validation as practical quality control:
- Clear constructs: each section measures one thing (not a mixed bag of “communication”).
- Consistent scaling: same response scale across items so results can be compared and trended.
- Reliability: similar items that should move together actually do.
- Actionability: the results point to decisions (what to change), not just descriptions (how people feel).
A useful definition of psychological safety is “a shared belief that the team is safe for interpersonal risk-taking,” meaning people can raise concerns and admit mistakes without fear of punishment or humiliation.
And psychological safety is not theoretical. A Harvard Business Review article referencing research on 27,000 healthcare workers reported that feeling psychologically safe was linked with reduced burnout and turnover intent, even when resources were constrained.

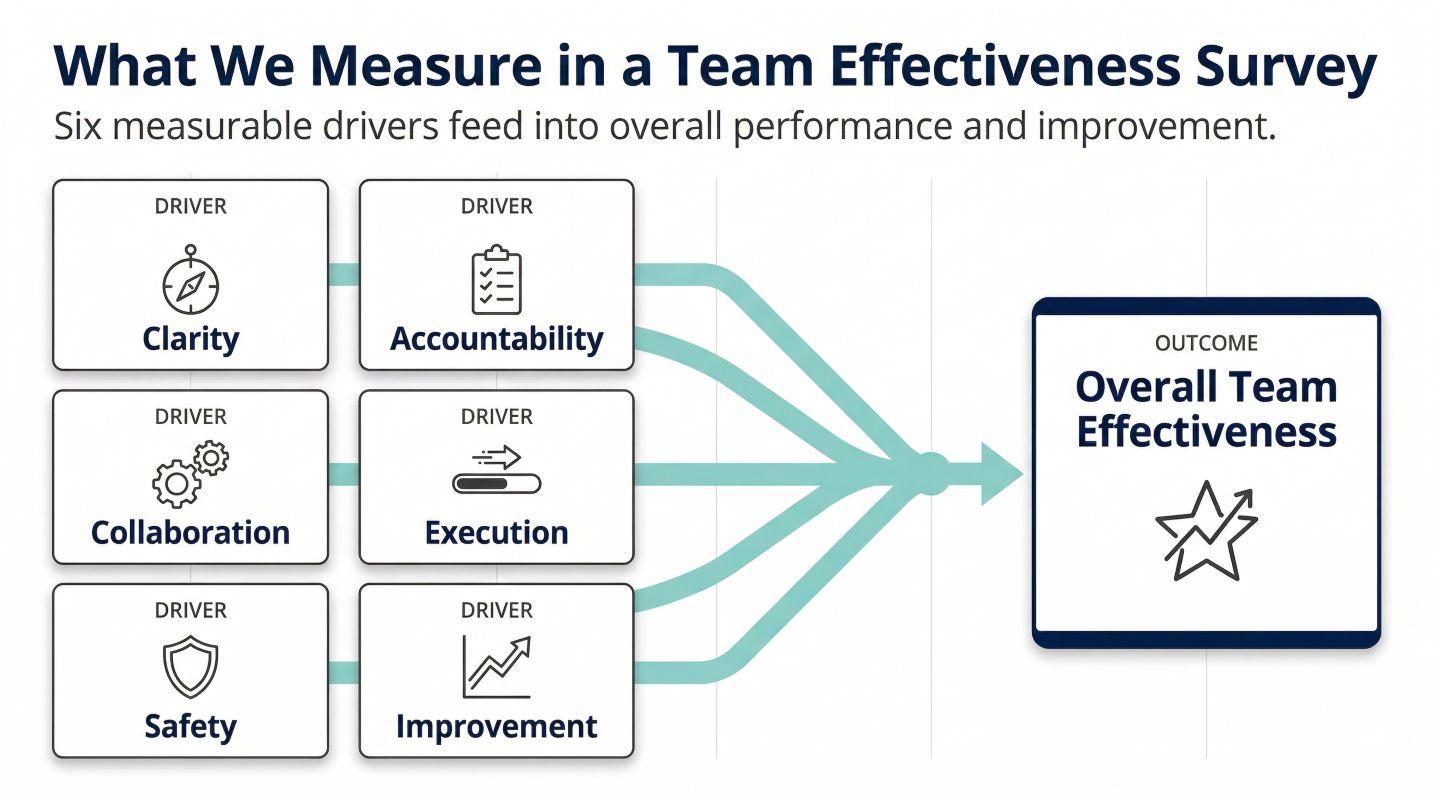
What to measure in a team effectiveness survey (6 dimensions)
If your survey measures everything, it measures nothing. Keep it focused on the few drivers that predict whether teams work well across different roles, geographies, and operating models.
These six dimensions cover the various aspects leaders actually need to manage: clarity, execution, collaboration, safety, ownership, and learning.
[Image: HR analyst comparing six team drivers in a radar chart across multiple teams. Alt: “Team effectiveness survey showing six drivers of overall team effectiveness”]
1) Clear goals and role clarity
Effective teams do not just “work hard.” They know what matters, what success looks like, and who owns what.
Measure whether:
- teams understand the team goal and near-term priorities
- roles and responsibilities are clear enough to avoid duplication and gaps
- work is aligned to objectives, not shifting opinions
What this looks like in practice: fewer resets, fewer meetings that end with “so what are we doing,” and less invisible work.

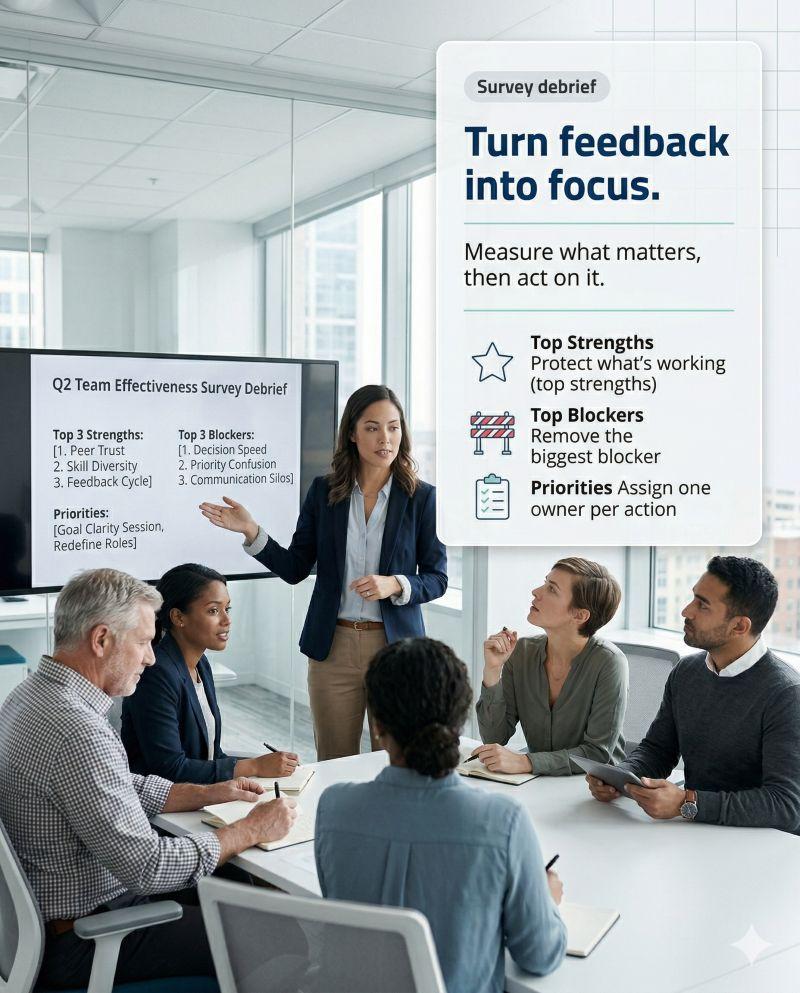
2) Collaboration and decision making process
Most teams do not fail because they lack talent. They fail because collaboration creates friction and decisions take forever.
Measure whether:
- team members collaborate effectively across functions and seniority
- the decision making process is understood (who decides, by when)
- disagreements lead to progress, not politics or silence
This is especially important for cross functional teams, where misalignment is the default unless you design against it.
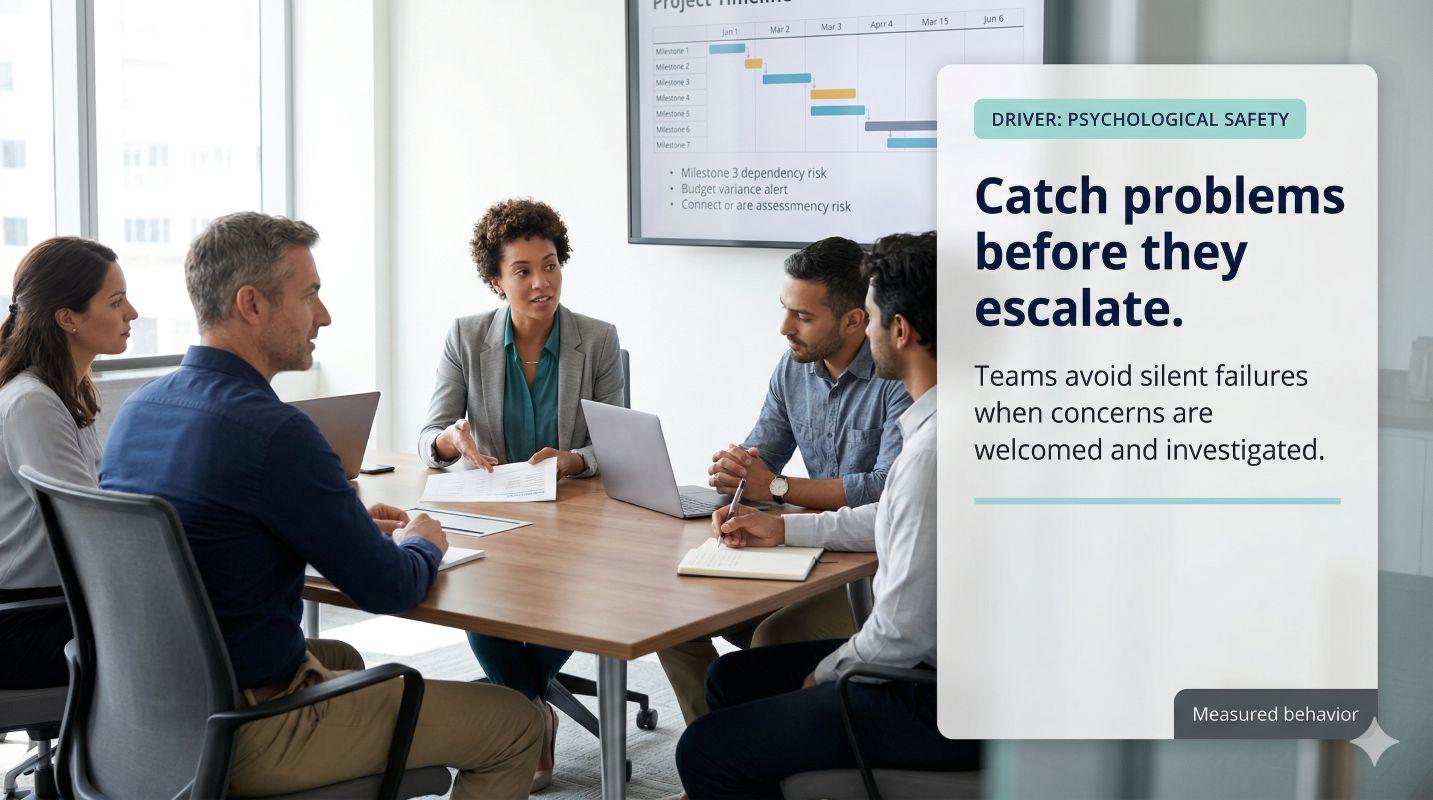
3) Psychological safety and trust
If people do not feel safe to speak up, you do not get “honesty.” You get delays.
Measure whether:
- team members can raise risks early without being punished
- people ask for help without reputation damage
- feedback is possible without retaliation or shutdown
Psychological safety is not comfort. It is the ability to surface reality fast enough to act on it.
4) Accountability and ownership
High performance teams are not “nice.” They are clear. They follow through.
Measure whether:
- ownership is explicit and tracked
- peers hold each other to commitments (shared commitment)
- the team solves problems instead of escalating everything upward
This dimension often exposes whether a team is operating like a unit or like a set of individual members sharing a calendar.
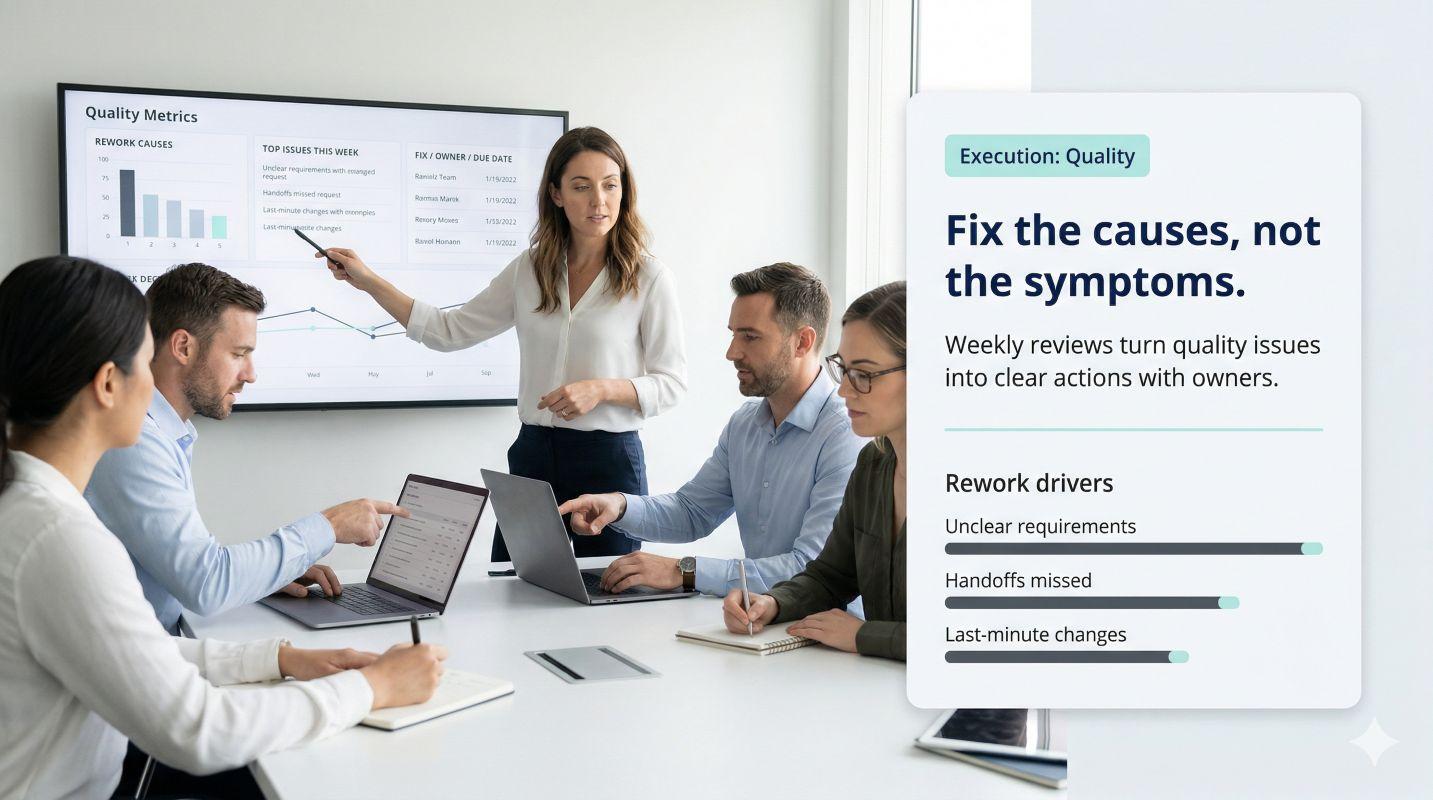
5) Execution and high quality work
Team effectiveness should show up in what the team delivers. This dimension connects the survey to outcomes leaders care about.
Measure whether:
- handoffs work without constant rework
- quality expectations are understood
- the team can deliver reliably under normal pressure
This also captures enablement issues: tools, skills, and staffing realities that block performance even when people are trying.
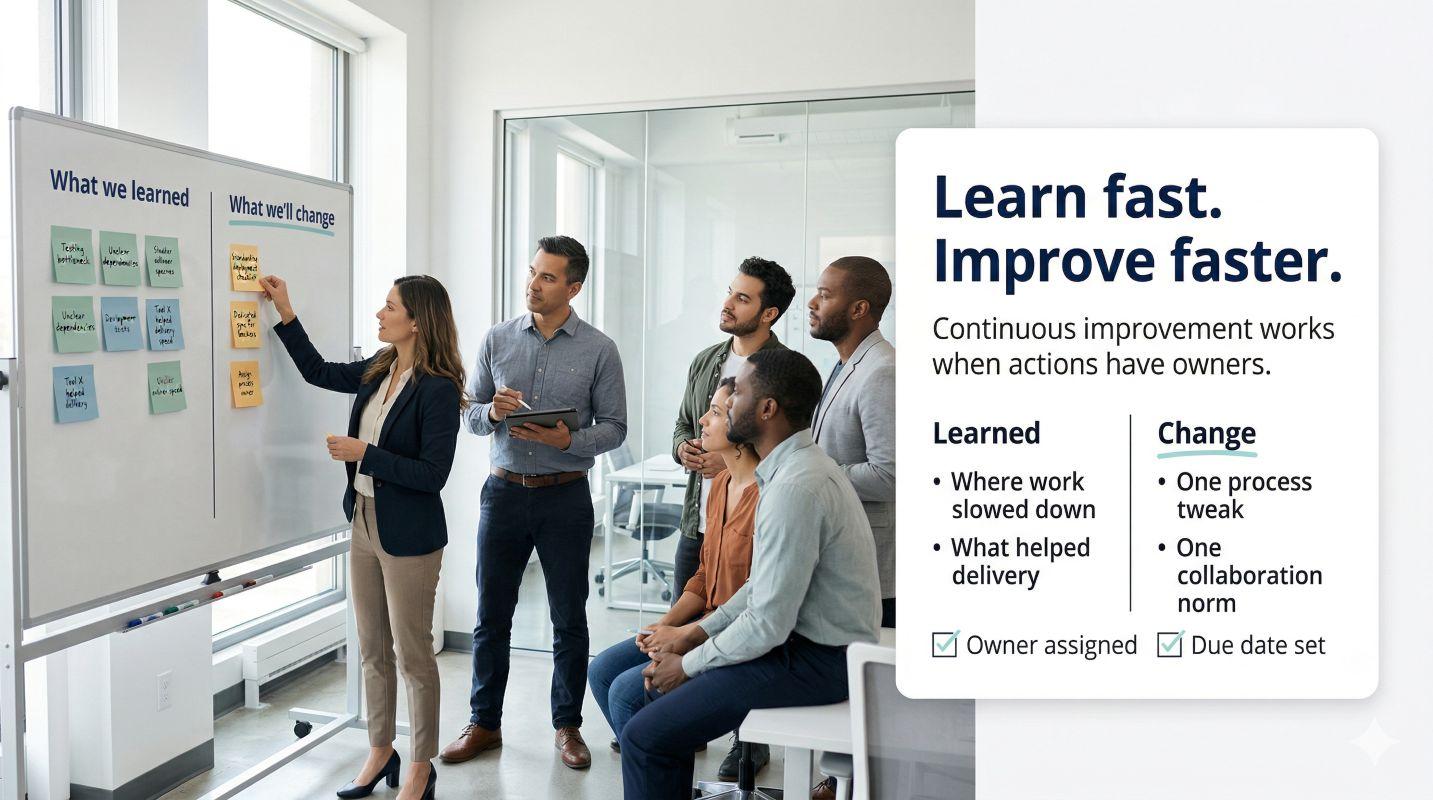
6) Continuous improvement and learning loops
Strong teams do not just execute. They learn and adapt. Weak teams repeat the same mistakes with better excuses.
Measure whether:
- the team reflects and improves its process
- lessons learned turn into changes, not slides
- people share information and create deeper insights over time
If you want long-term organizational success, you need this loop to be real, not ceremonial.
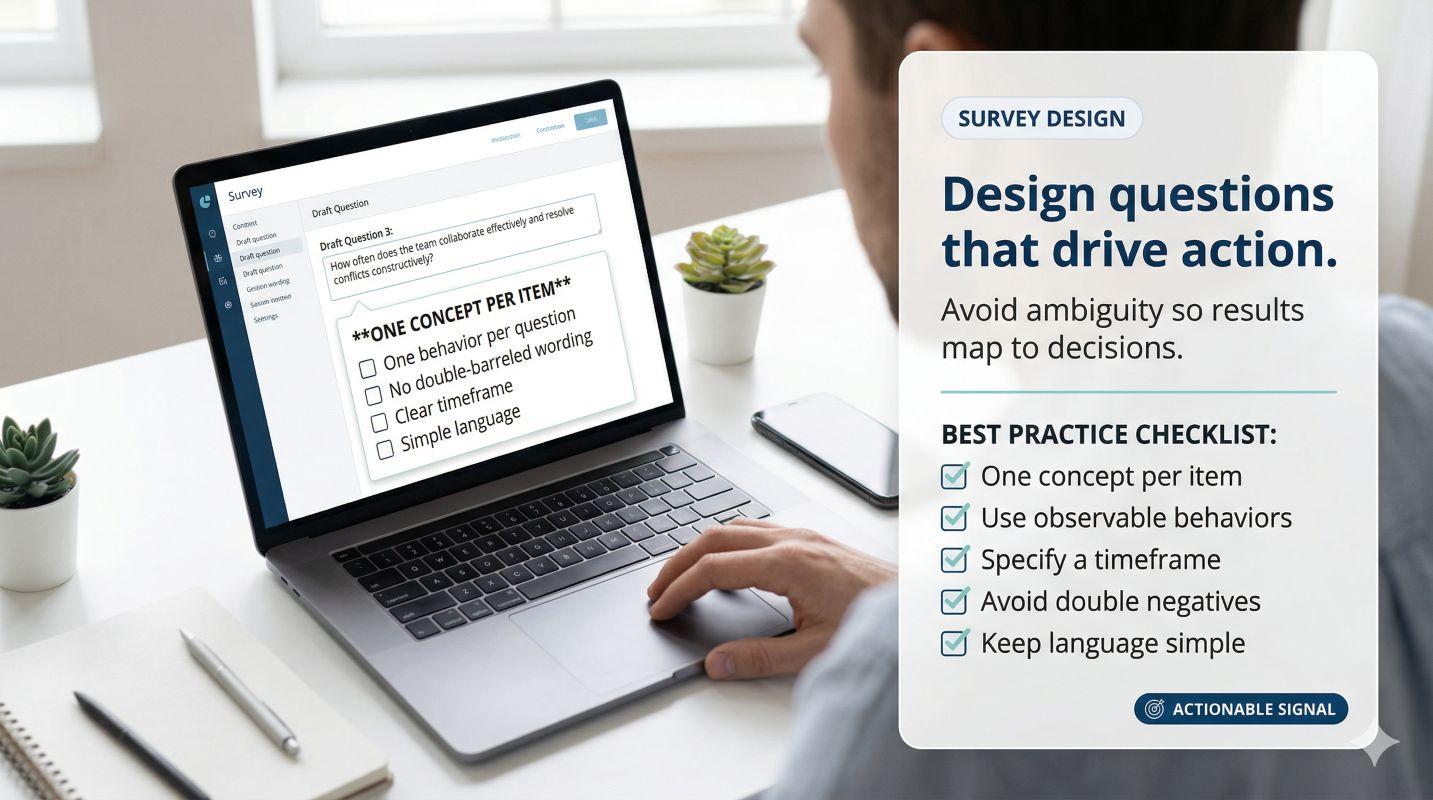
Team effectiveness survey questions: design principles and examples
A survey is only useful if it produces actionable insights. That means your questions have to be specific enough to diagnose a driver, but simple enough that people can answer fast and consistently.
Design rules that keep this clean:
- One idea per item. No “We communicate well and collaborate effectively” mashups.
- Behavior over aspiration. Ask what happens, not what people wish happened.
- Use the same scale across Likert items. It makes benchmarking and trends possible.
- Write items so a team can disagree honestly. If every item sounds like “Good teams do X,” people will respond performatively.
Below is a compact question set: 3 Likert items + 1 open-text prompt per dimension. This is enough to assess team dynamics without creating response fatigue.
Recommended Likert scale (use for all items)
Use a 5-point scale for consistency:
1 = Strongly disagree
2 = Disagree
3 = Neutral / Not sure
4 = Agree
5 = Strongly agree
If you need a “Not applicable,” treat it separately (don’t mix it into the 1–5).
A) Clear goals and role clarity (Likert + open text)
Likert items
- “Our team has clear goals for the next 30–60 days.”
- “I understand how my work connects to our team’s objectives.”
- “Ownership for key workstreams is clear (we know who is responsible).”
Open text
- “What is the biggest source of confusion about goals, priorities, or ownership right now?”
B) Collaboration and decision making process
Likert items
- “We involve the right people when decisions are made.”
- “When we disagree, we reach decisions in a reasonable timeframe.”
- “We have a clear way to escalate decisions without creating bottlenecks.”
Open text
- “Where do decisions get stuck, and what would unblock them?”
C) Psychological safety and trust
Likert items
- “People on this team can raise concerns early without negative consequences.”
- “It is safe to ask for help when I’m blocked.”
- “Mistakes are used to improve the process, not to assign blame.”
Open text
- “What topics or issues do people avoid bringing up, and why?”
D) Accountability and ownership
Likert items
- “Commitments are tracked and followed up on (not forgotten after meetings).”
- “When something slips, we address it directly and constructively.”
- “Our team reliably delivers on what we commit to.”
Open text
- “What is one recurring commitment or responsibility that often slips, and what causes it?”
E) Execution and high quality work
Likert items
- “Quality expectations are clear for the work we deliver.”
- “Handoffs between roles are smooth (we avoid avoidable rework).”
- “We have the tools and processes needed to do high quality work.”
Open text
- “Where does rework happen most often, and what is the root cause?”
F) Continuous improvement and learning loops
Likert items
- “We regularly reflect on what’s working and what isn’t.”
- “We turn lessons learned into changes we actually implement.”
- “We share useful information openly instead of keeping it in silos.”
Open text
- “What is one small change that would most improve how this team works?”
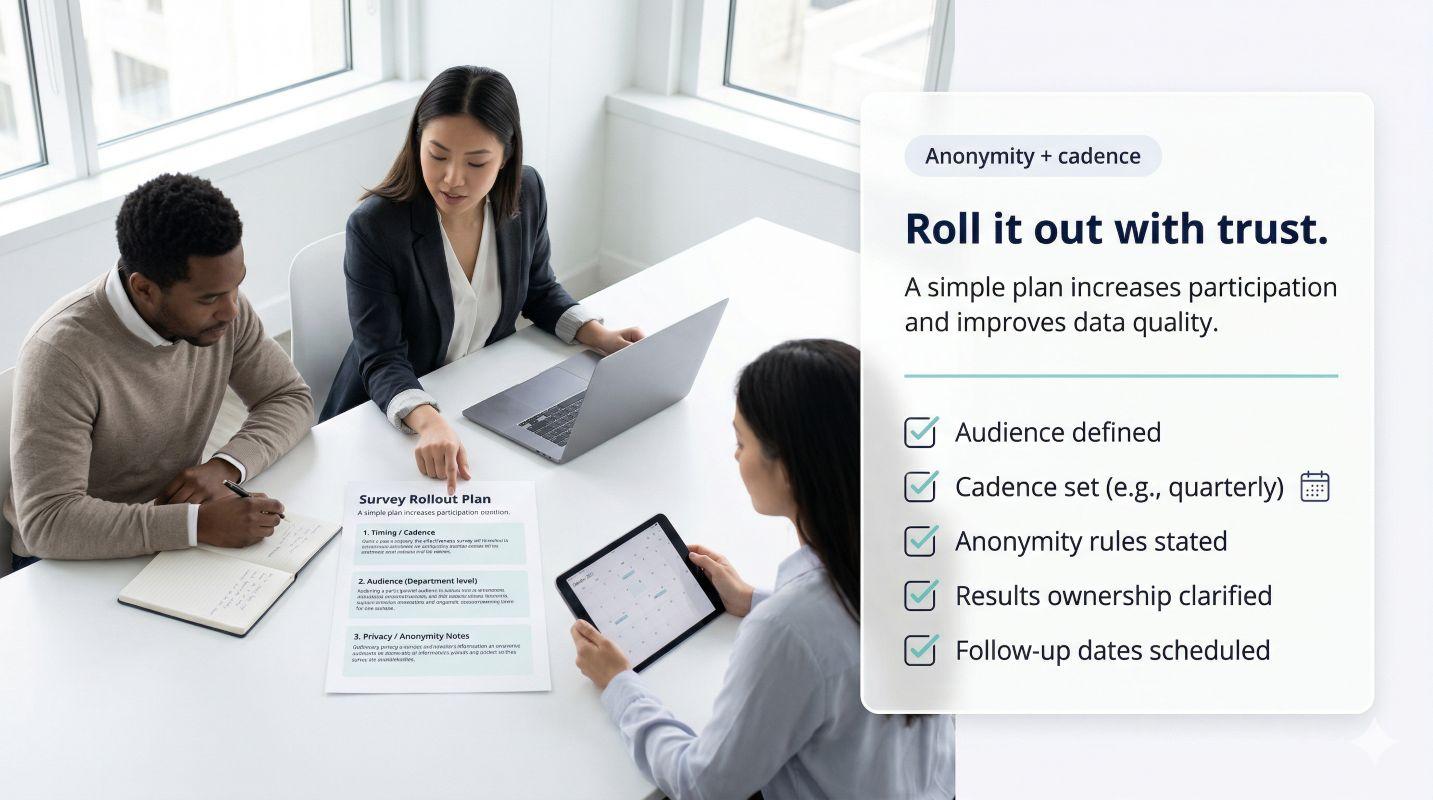
How to run the survey (format, anonymity, cadence)
A team effectiveness survey fails for two predictable reasons: it’s too long, or people don’t trust what will happen with their answers. Fix those, and response quality jumps.
Format: keep it short and consistent
Use one core format across the entire instrument:
- Likert items (5-point scale): the backbone for benchmarking and trends
- Open-text prompts: limited, targeted, used to explain the “why” behind scores
Length guidance that works in real companies:
- 18–30 Likert items total (your set above is 18)
- 3–6 open-text prompts total (not 18). Pick the most diagnostic ones.
If you include an open-text prompt for every dimension, you’ll get shallow answers or copy-paste gripes. Better approach: keep all Likert items, then use 3 open-text prompts that pull out blockers and solutions.
Suggested open-text set (max value per word):
- “What is the biggest thing slowing this team down right now?”
- “What should we change first to improve how this team delivers?”
- “Where do decisions or handoffs get stuck most often?”
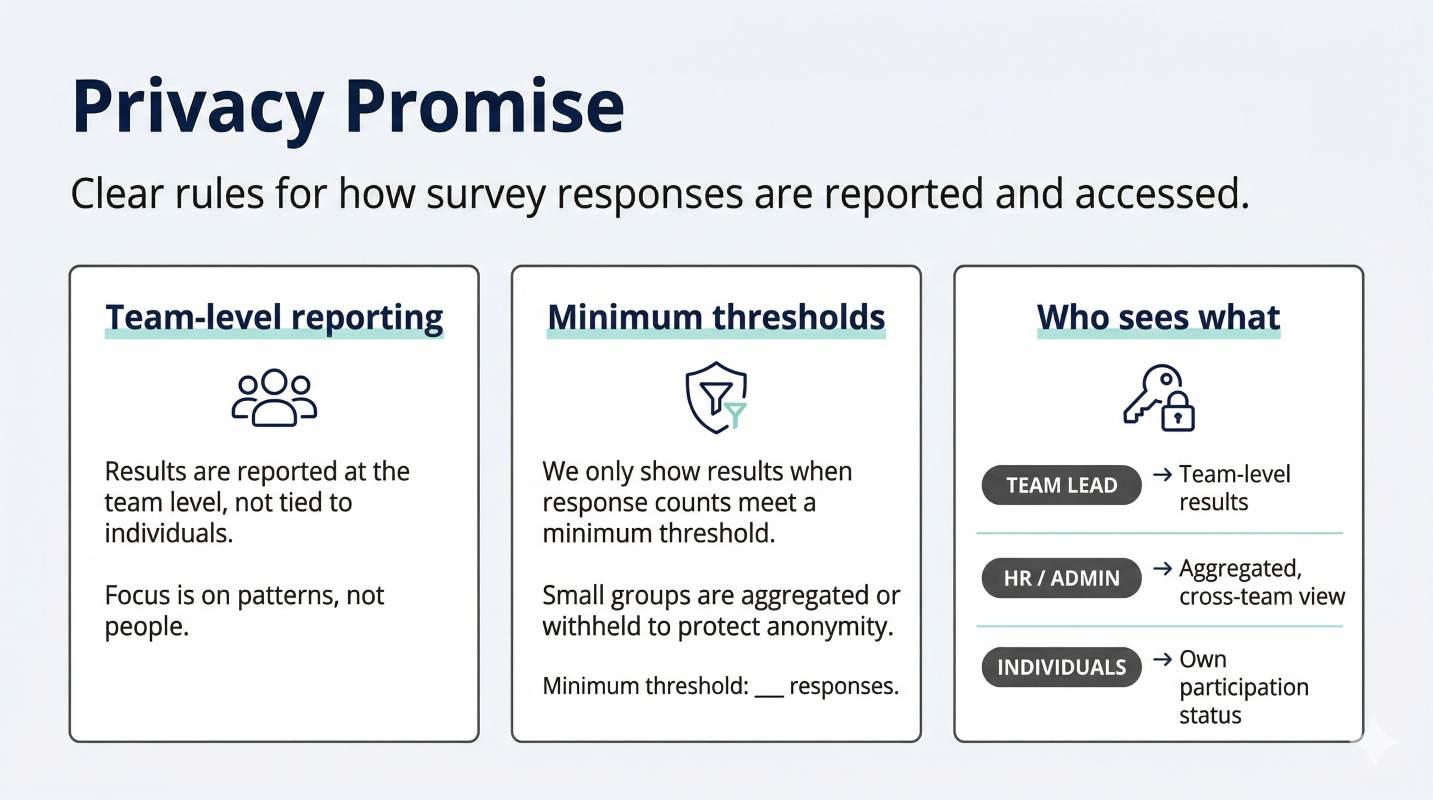
Anonymity and confidentiality: what to promise (and keep)
If people think this is a performance evaluation in disguise, the data will be useless. Your policy has to be clear enough that a cynical employee can’t poke holes in it.
Minimum standards:
- Report results at team level, not individual level
- Do not share raw comments with names or identifiable details
- Set a minimum response threshold (commonly 5+ respondents) before reporting a team slice
- Explain exactly who will see the results: manager, HR, leadership
Practical rule: if a team is small, group it with a comparable team or report only on org-level trends.
Who should be included (entire team, leaders, stakeholders)
Start simple:
- The entire team completes the survey (including the manager).
- Avoid adding stakeholders at first. That creates politics and muddier data.
If you have a strong reason to include partners (for example, internal clients who depend on delivery), do it as a separate input stream so you can compare perspectives without mixing them.
Cadence: how often to run it
You want frequent enough to track progress, not so frequent it turns into noise.
Global default for most teams:
- Quarterly for teams in active delivery cycles or heavy change
- Twice per year for stable teams with predictable work
For project teams or short-term initiatives:
- baseline at kickoff
- mid-point pulse
- end-of-project review
If you’re trying to fix a real problem, add a short pulse (6–10 items) monthly for 2–3 months, then return to quarterly. Don’t keep pulsing forever. People will stop caring.
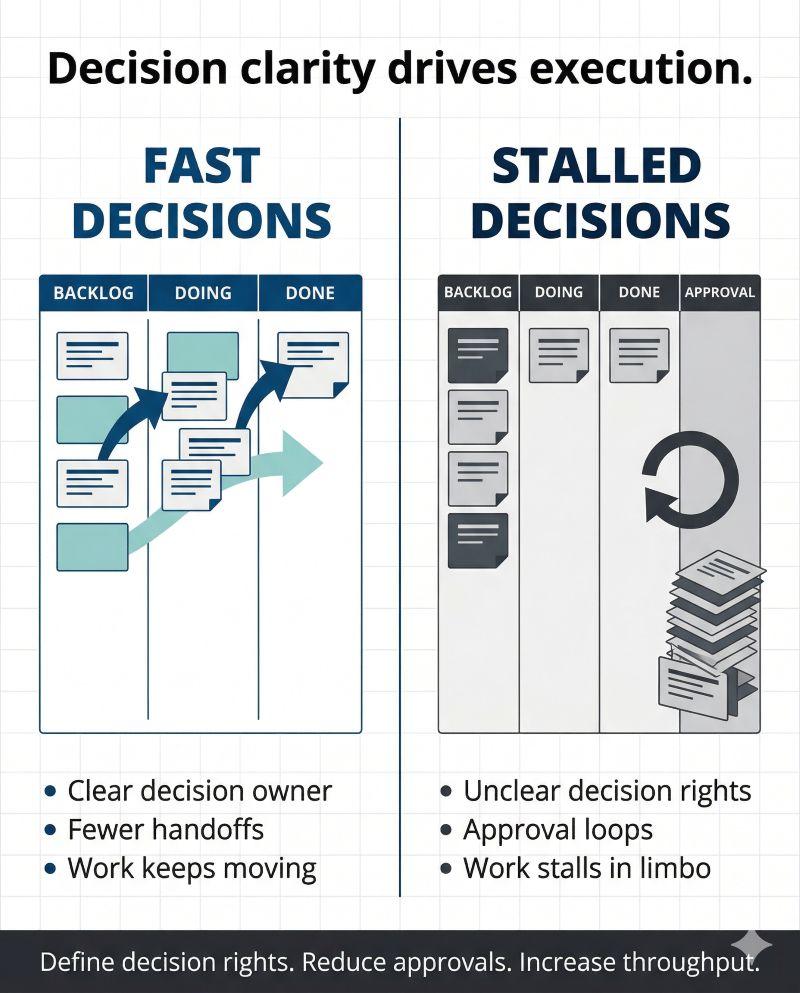
How to analyze survey results and improve team effectiveness
Collecting data is the easy part. The value comes from turning survey results into a short list of decisions the team can execute without drama.
Step 1: Build the right views (team-level first, org-level second)
Start with two views. Anything more is usually analytics cosplay.
Team view (primary)
- overall team effectiveness (average of dimensions)
- dimension scores (the six drivers)
- score distribution (how aligned the team is, not just the average)
Organization view (secondary)
- dimension averages across teams
- variance by team (where performance is inconsistent)
- trend over time by function or team type (project teams vs stable teams)
Do not rank teams publicly. If leaders want a leaderboard, they can go play video games. The point is improvement, not humiliation.
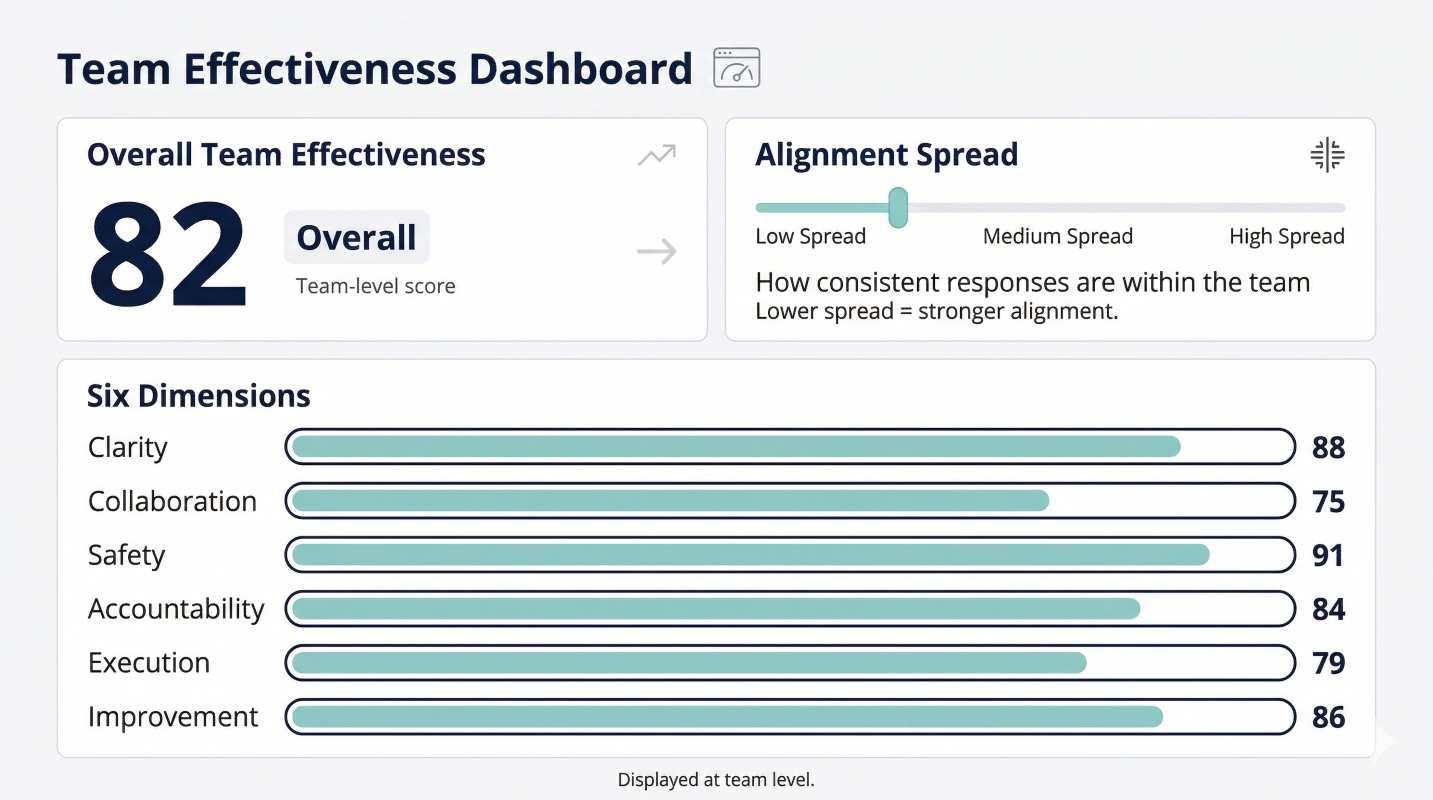
Step 2: Look for “spread” before you obsess over averages
Averages hide misalignment. A team with a 3.6 average and high spread often has a bigger problem than a team with a 3.4 average and tight alignment.
Watch for:
- High spread on clear goals: people are not working from the same priorities
- High spread on psychological safety: some people speak, others stay quiet
- High spread on accountability: expectations differ by role or seniority
Actionable rule: when spread is high, fix alignment first. Otherwise your intervention only works for the people already bought in.
Step 3: Identify the “lowest driver with leverage”
Teams can’t fix six things at once. Pick the driver that is both low and likely to unlock other improvements.
Common leverage patterns:
- Clear goals low: everything else becomes friction and rework
- Decision making low: execution slows, accountability gets fuzzy
- Psychological safety low: problems surface late, learning stalls
- Accountability low: improvements fail because follow-through fails
The right output from analysis is not “here are the scores.” It’s:
“Here are the 1–3 drivers most likely to improve overall team effectiveness if we fix them first.”
Step 4: Use comments for diagnosis, not for entertainment
Open-text responses can create valuable insights or a complaint festival. Make them usable:
- cluster comments into themes (3–7 max)
- separate symptoms (“communication is bad”) from causes (“handoffs unclear,” “decisions lack owner”)
- treat one-off rants as noise unless repeated
If you share comments with a team, summarize themes first. Raw comment dumps trigger defensiveness and kill psychological safety.
Step 5: Turn results into 1–3 actions per team
This is where most teams fail: they create a list of 14 “initiatives” that nobody owns.
Use a tight action format:
- Action: what exactly will change
- Owner: one accountable person (not “the team”)
- When: deadline and check-in date
- Success measure: a visible behavior or metric
Examples that are actually executable:
If clear goals is low
- Action: publish a one-page “team goal + top 5 priorities + what we’re not doing” every month
- Success: team members can state priorities consistently; fewer mid-week priority changes
If decision making is low
- Action: define decision owners for top recurring decisions and set a default decision window
- Success: fewer stalled items; fewer escalations for routine decisions
If accountability is low
- Action: commit to a weekly 15-minute follow-up on owners and deadlines
- Success: fewer missed commitments; less last-minute scrambling
Step 6: Close the loop publicly and quickly
If people give feedback and nothing changes, your next survey will be garbage.
Minimum loop:
- manager shares results within 7–14 days
- team agrees on 1–3 actions in the same meeting or the next one
- leadership removes one constraint if it’s structural (capacity, tooling, unclear strategy)
When to use it and how to roll it out (pilot to scale)
This survey is most valuable when leaders need a clear read on whether teams can execute reliably, not when HR wants another “culture initiative.”
When to use a team effectiveness survey
Use it when there’s a real decision to make or a real risk to reduce:
- New team launches or new managers: establish a baseline and prevent “silent dysfunction” from becoming normal.
- Post-restructure / post-merger: check whether roles, goals, and decision rights actually landed.
- Cross functional teams with recurring friction: surface where handoffs, ownership, or approvals break down.
- Leadership coaching and team development programs: track whether coaching changes team conditions, not just manager intent.
- Delivery issues that keep repeating: missed deadlines, rework, quality problems, slow decisions.

Pilot first (and define what “success” means)
A pilot prevents the two classic rollout failures: confusing questions and zero follow-through.
Pilot setup:
- 3–6 teams, ideally a mix (stable team + project team + cross functional team).
- Run the survey, then do one structured debrief per team.
- Track: response rate, clarity issues, time-to-complete, and whether results led to real actions.
Pilot success criteria (keep it measurable):
- completion time stays under ~10 minutes
- leaders can explain the top 1–3 drivers for their team without hand-waving
- each team leaves with 1–3 actions, owners, and a review date
Scale rollout (without turning it into bureaucracy)
Once the pilot works, scale with simple governance:
- Standard survey core (don’t let every department rewrite it).
- Standard reporting views (team dashboard + org trend view).
- Standard action format (action, owner, deadline, success measure).
- One accountability checkpoint (leaders confirm debrief happened and actions exist).
Keep one controlled “customization” lever: optional 3–5 items that a function can add for context (example: handoffs for ops, decision speed for product). Everything else stays stable so you can trend over time.
Monitor adoption and improve the survey itself
A survey is a product. Treat it like one.
What to review after each cycle:
- response rate by team
- which questions produce unclear or repetitive answers
- whether teams actually executed their 1–3 actions
- whether dimension scores and alignment improved over time
If the organization is not acting on results, don’t run the next cycle. Fix follow-through first. Otherwise you train employees that feedback is pointless.
FAQ: Team effectiveness survey
What are the best team effectiveness survey questions?
The best team effectiveness survey questions measure a small set of drivers that predict performance: clear goals, decision making, collaboration, psychological safety, accountability, execution quality, and continuous improvement. Use behavior-based items with one concept per question, plus a few open-text prompts to explain low scores.
How do you measure team effectiveness?
Measure overall team effectiveness by scoring core dimensions at the team level and tracking trends over time. Combine an overall score with dimension scores and score distribution so you can see both performance and alignment, not just an average.
What makes a team effective?
Effective teams share the same basics: clear goals, fast and understood decision rights, trust and psychological safety, explicit ownership, reliable execution, and a habit of learning from outcomes. The exact culture varies, but the operating conditions tend to repeat across industries.
How do you improve team effectiveness after a survey?
Pick 1–3 drivers with the most leverage, define concrete actions, assign a single owner per action, set deadlines, and check progress quickly. The fastest way to kill improvement is a long action list with no owners and no review date.
How do you measure team dynamics and psychological safety?
Use specific items that test whether people can raise concerns, ask for help, and admit mistakes without negative consequences. Look for both the average score and the spread. High spread often indicates that only part of the team feels safe to speak up.
Conclusion: a practical way to improve team effectiveness
A team effectiveness survey works when it measures the right drivers, stays short enough to earn honest participation, and leads to visible action. Keep the instrument consistent, trend results over time, and focus teams on a small number of changes that improve how they deliver.
If you want to see how a structured, scientifically grounded approach can help you measure and improve team effectiveness in your roles and teams, you can test OAD for free and compare candidates and teams with data instead of gut feel.