Measuring teamwork is one of those management habits that sounds noble and turns into a spreadsheet crime scene fast. The goal is not to “track people.” The goal is to understand whether the team is producing results reliably, working well together, and improving over time without burning out or silently falling apart.
Table of Contents
- Why measure teamwork in the first place?
- Start With the Basics: What Are You Measuring?
- Key Metrics to Measure Teamwork
- Quantitative Performance Metrics
- Qualitative Measures That Create Valuable Insights
- Measuring Team Dynamics and Collaboration Patterns
- Tools and Methods for Measuring Teamwork
- Surveys, Observations, and Meetings for Measuring Teamwork
- Turning Metrics Into Informed Decisions
- Meeting Goals and Accountability Without Toxicity
- Getting Started: A 90-Day Plan to Measure Teamwork
- FAQ: How Do You Measure Teamwork?
- Conclusion: Choose Metrics That Improve Performance, Not Just Track It
Good measurement gives you three things:
- A clear understanding of what “good teamwork” looks like in your environment.
- Early warning signals before missed deadlines, rework, or conflict become expensive.
- A way to make informed decisions instead of guessing based on the loudest voice in the room.
Why measure teamwork in the first place?
Teamwork is not a vibe. It’s a system of behaviors that should create a positive impact on business outcomes: speed, quality, customer experience, retention, and delivery. If you cannot measure teamwork, you end up rewarding optics. People who talk confidently in meetings look like “high performers,” while the team quietly pays for poor handoffs, unclear ownership, and weak accountability.
Measuring team performance also helps you separate two different problems:
- The team has the right people, but the system is broken (process, role clarity, decision-making).
- The system is fine, but the mix of people is wrong (skill set, behavior patterns, misaligned working styles).
If you skip measurement, you usually fix the wrong thing. That’s how you get endless “team building” and no improvement.

What “team success” actually means in your organization
Before you pick key metrics, define the purpose. Teams do different jobs, so “team success” cannot be a copy-paste definition.
A practical definition of team success should cover three layers:
- Outcomes
Did the team deliver results that matter to the business? Think deliver results, quality, deadlines, customer impact. - Operating health
Did the team get results at a sustainable rate? Or did it rely on heroics, poor attendance being ignored, or constant context switching? - Collaboration and decision quality
Did the team share goals, stay on the same page, handle opposing opinions productively, and avoid recurring poor decision making?
If you only measure outcomes, you might reward toxic or fragile performance. If you only measure “team environment,” you can end up with pleasant meetings and mediocre delivery. You want the full picture.
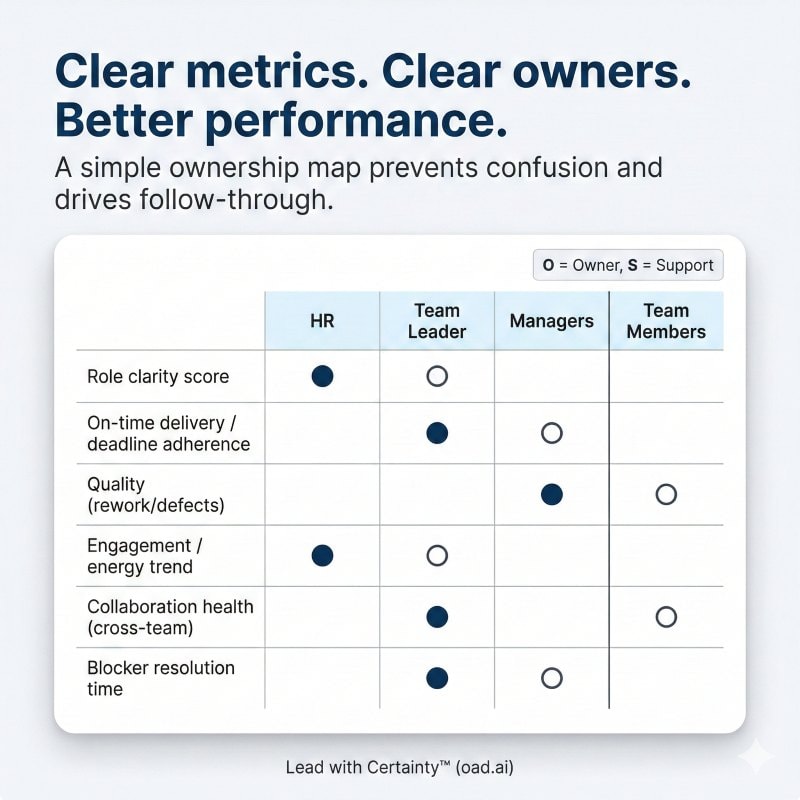
Who should collect the data?
If the same person owns every metric, you get bias. If nobody owns the metrics, you get a dashboard that dies quietly after two weeks.
Use a simple ownership model:
- Team leader: owns team performance metrics, meeting goals, and accountability rhythms.
- Managers/Project owners: validate progress, blockers, and delivery quality.
- Team members: provide qualitative insights through pulse surveys and structured feedback.
- HR/People Ops: ensures measurement is consistent, fair, and not used as surveillance.
You also need to decide what data is appropriate at team level vs individual level. Measuring team member performance is useful, but only if you can separate performance from personal circumstances, unclear roles, or broken workflows. Otherwise you’re just generating resentment with extra steps.
Start With the Basics: What Are You Measuring?
Most teamwork measurement fails because people mix three different things into one sloppy score. Then they act surprised when the numbers don’t help.
You’re measuring three categories. Keep them separate, then connect them later.
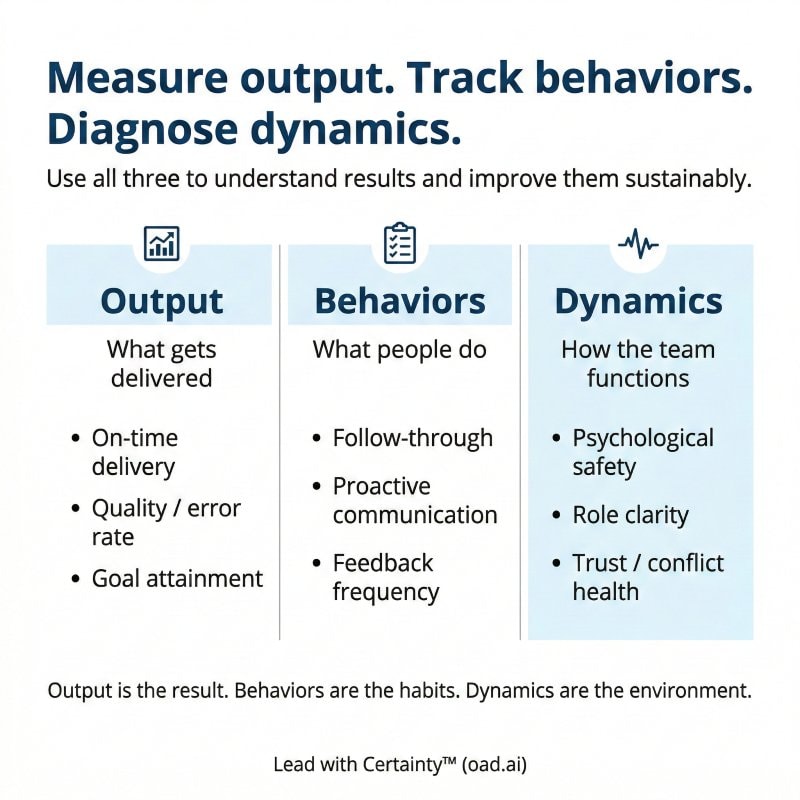
Output vs. behavior vs. team dynamics (the three standard ways to measure teamwork)
1) Output (results):
What the team produces. Delivery, quality, throughput, customer outcomes. This is the easiest to measure and the easiest to misuse.
2) Behaviors (how work gets done):
Reliability, ownership, handoffs, responsiveness, preparation, follow-through. This is where “good teams” differ from teams that just get lucky.
3) Team dynamics (how people function together):
Trust, psychological safety, conflict handling, inclusion of new members, and whether opposing opinions are resolved or buried. This is the stuff that silently determines whether performance is sustainable.
If you only track output, you miss why performance is happening. If you only track dynamics, you risk measuring feelings instead of results. A workable system uses both.
Measuring team performance vs. team member performance
Team performance answers: “Did we deliver, and did we deliver well?”
Team member performance answers: “Who is enabling or limiting that outcome?”
This matters because individual performance inside a weak system can look like failure. Meanwhile, a strong system can make average performance look great.
To avoid bad calls, follow two rules:
- Measure team performance first. If the system is broken, don’t pretend you’re doing “performance management.” You’re doing blame allocation.
- Use individual metrics sparingly and contextually. Individual performance metrics work best when roles are stable, tasks are clearly owned, and the team environment is not chaotic.
If you’re dealing with constant switching, unclear ownership, or too many assertive leaders pulling in different directions, individual metrics become noise. In those environments, early risk alerts for burnout and disengagement are more useful than granular scorecards.
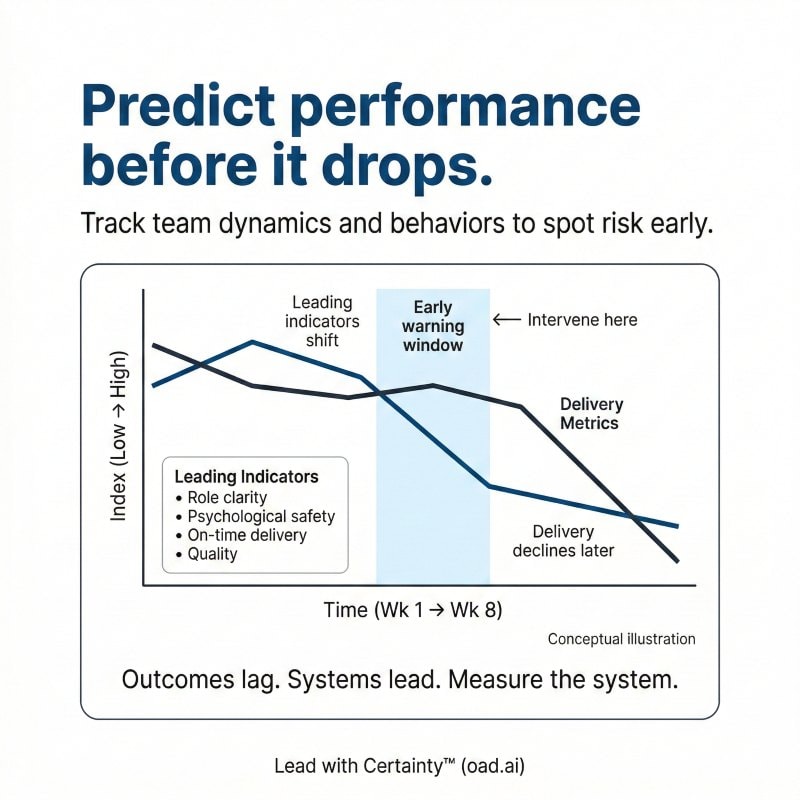
Leading indicators vs. lagging indicators
Lagging indicators tell you what already happened.
Leading indicators tell you what is likely to happen next.
Both matter. Most teams obsess over lagging indicators because they’re easy.
Lagging indicators (examples):
- deadlines missed
- quality defects found late
- customer complaints
- team completes less work than planned
Leading indicators (examples):
- unresolved blockers piling up
- meeting goals unclear or constantly changing
- low participation or poor preparation in team meetings
- pulse survey signals dropping (engagement, psychological safety)
- collaboration patterns showing bottlenecks (one person overloaded, others disconnected)
Leading indicators help you prevent problems. Lagging indicators help you diagnose and confirm.
A “right metrics” set always includes at least one leading indicator for each critical outcome you care about: speed, quality, and team health.
Key Metrics to Measure Teamwork
You don’t need 40 metrics. You need a small set of defined metrics that give an accurate picture, help the team stay on the same page, and force better decisions. Everything else is decoration.
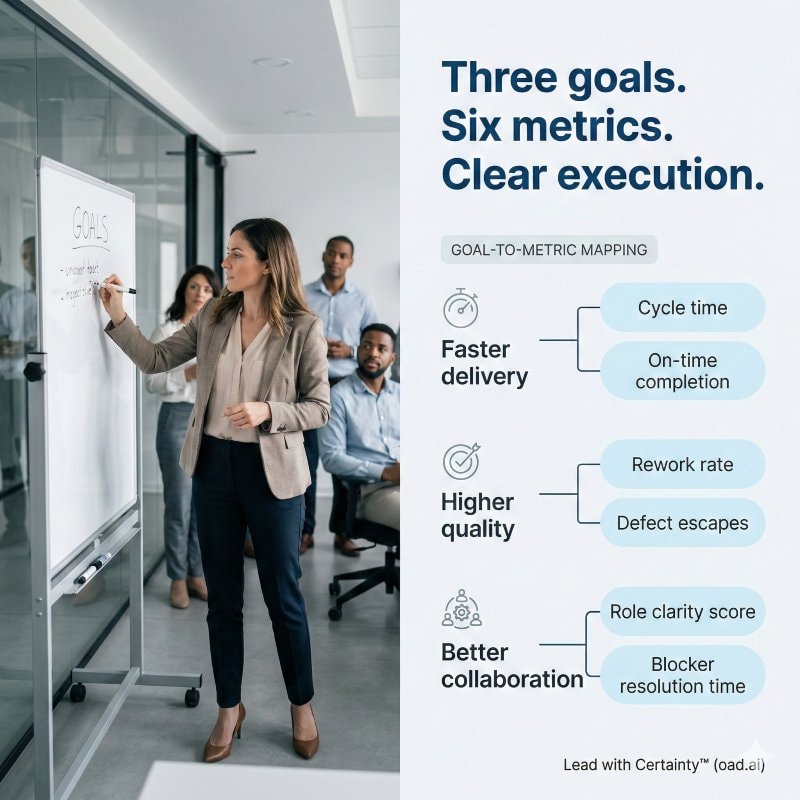
A practical system usually lands at 6–10 core metrics, split across delivery, quality, collaboration, and team environment.
The shortlist: key metrics that fit most teams
Use this as your starting list. You will adjust based on your team’s goals.
Delivery and productivity
- On-time delivery vs. planned deadlines
- Throughput (work completed per sprint/week/month)
- Work-in-progress (WIP) or queue size (how much is stuck)
Quality
- Defect rate or rework rate
- First-pass acceptance rate (work approved without major revisions)
Collaboration and decision-making
- Blocker aging (how long blockers sit unresolved)
- Handoff friction (where work repeatedly bounces back and forth)
- Meeting decision quality (decisions made, owners assigned, follow-through)
Team health
- Pulse survey trend (employee engagement and psychological safety)
- Attendance and punctuality patterns (poor attendance is a real signal, not a moral issue)
Behavior signals (use carefully)
- Peer-to-peer recognition frequency (as a signal of visible contribution)
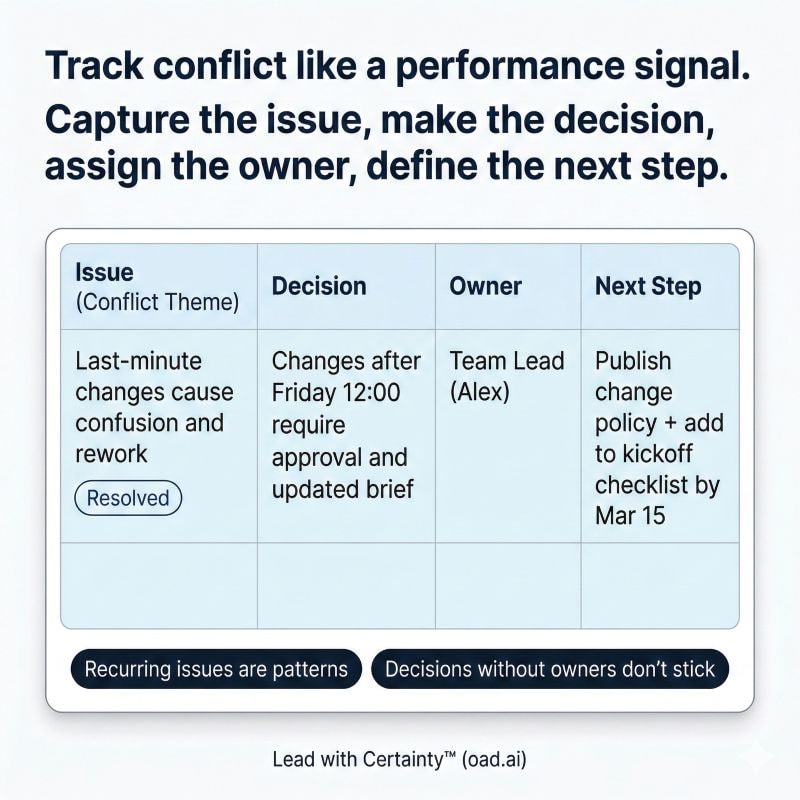
- Recurring conflict flags (themes, not “who said what”)
This gives you a full picture without turning the team into lab rats.
How to prioritize metrics aligned with shared goals
Pick metrics by starting with the business outcome, then walking backwards.
- What does the team need to deliver results?
Speed? Quality? Innovation? Customer experience? - What is currently getting in the way?
Poor handoffs, unclear ownership, too many meetings, low psychological safety, skill gaps, new members onboarding, unclear priorities. - Which metrics would change decisions?
If a metric will not change what you do next week, cut it.
A helpful filter: choose metrics that answer these questions:
- Are we making progress?
- Is the work good?
- Are we collaborating effectively?
- Are we operating at a sustainable rate?
If a metric doesn’t map to one of those, it’s probably a vanity metric.
Assign an owner for each performance metric (accountability without blame)
Every metric needs an owner, or it will drift into irrelevance. Ownership does not mean the person is “responsible for the number.” It means they are responsible for:
- collecting the quantitative data consistently
- validating it (no garbage inputs)
- posting it visibly
- prompting the team to interpret it and act
A simple ownership model:
- Delivery metrics: project owner or team leader
- Quality metrics: QA lead, reviewer, or process owner
- Health metrics (pulse surveys): HR or People Ops runs it, team leader owns the response plan
- Collaboration metrics (blockers, handoffs): team leader or operations lead
This is how you avoid the classic failure: a dashboard exists, leadership feels informed, the team changes nothing, and everyone pretends measurement “didn’t work.”
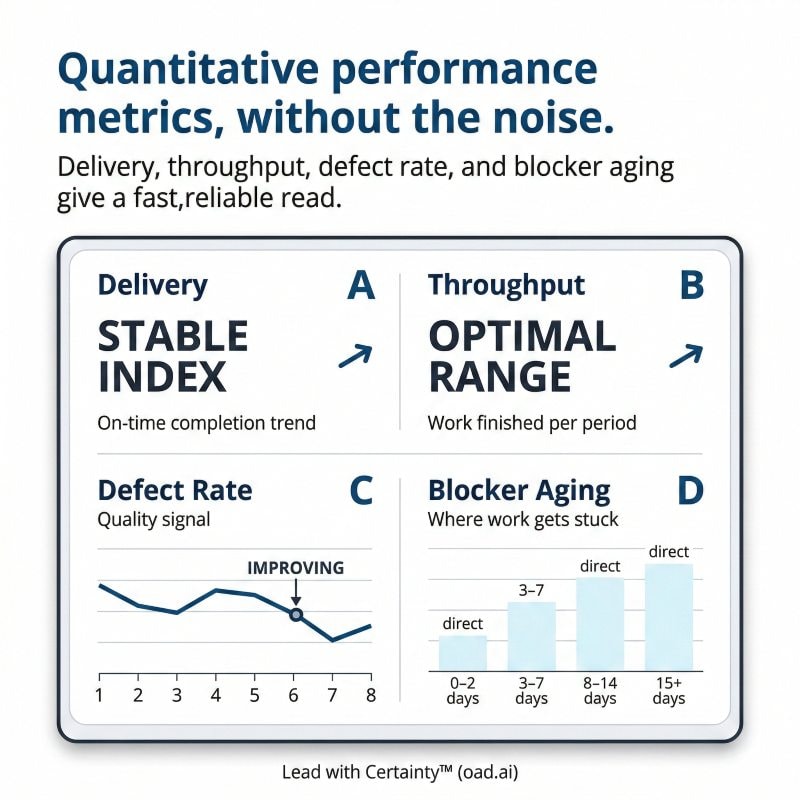
Quantitative Performance Metrics
Quantitative data is useful because it forces clarity. It’s also dangerous because humans love pretending a number is the truth instead of a signal. Use these metrics to spot patterns, not to micromanage.
Task completion rate and throughput at a sustainable rate
Task completion rate tells you whether work actually gets finished, not just started.
Throughput tells you how much the team completes per time period.
Track one of these consistently (weekly or per sprint). Then add a basic sustainability check:
- Is throughput stable, improving, or volatile?
- Does output spike only when people work late or skip quality checks?
- Is work getting completed evenly, or dependent on one overloaded person?
A team can look “productive” while building a backlog of unfinished work, rework, and resentment. Sustainable rate matters because it predicts whether performance will hold.
On-time delivery vs. planned deadlines
On-time delivery is a core teamwork metric because it reveals planning quality, handoffs, and follow-through.
Track:
- % delivered on time
- average delay (in days) for late items
- top reasons for misses (blockers, scope creep, unclear ownership, dependencies)
This metric becomes meaningful when you pair it with context. If deadlines are unrealistic or constantly changing, “on-time” becomes a fake standard. Fix planning before you punish performance.
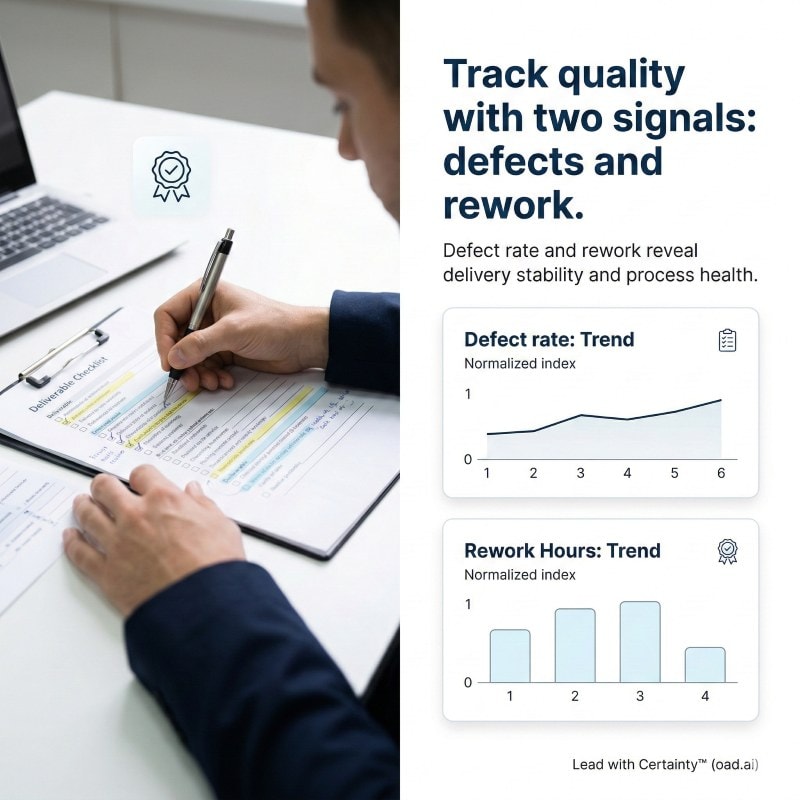
Defect rate, rework, and quality escapes
Quality is teamwork. Rework is teamwork failure with extra steps.
Choose a quality metric that fits your work:
- Defect rate: number of defects per deliverable, release, or time period
- Rework rate: how often work is sent back for major revisions
- First-pass acceptance rate: work approved without major changes
- Quality escapes: issues found after delivery by customers or downstream teams
Track trend, not just totals. A rising defect rate usually signals one of these:
- unclear standards
- rushed delivery to “meet goals”
- weak review process
- skill gaps
- poor handoffs between roles
This is also where OAD’s angle matters: if the team repeatedly struggles with ownership, detail orientation, or conflict handling, those are often stable behavior patterns, not just “bad weeks.” A quick, clinically validated personality assessment helps you understand team member performance in context, instead of guessing based on who looks confident in meetings.
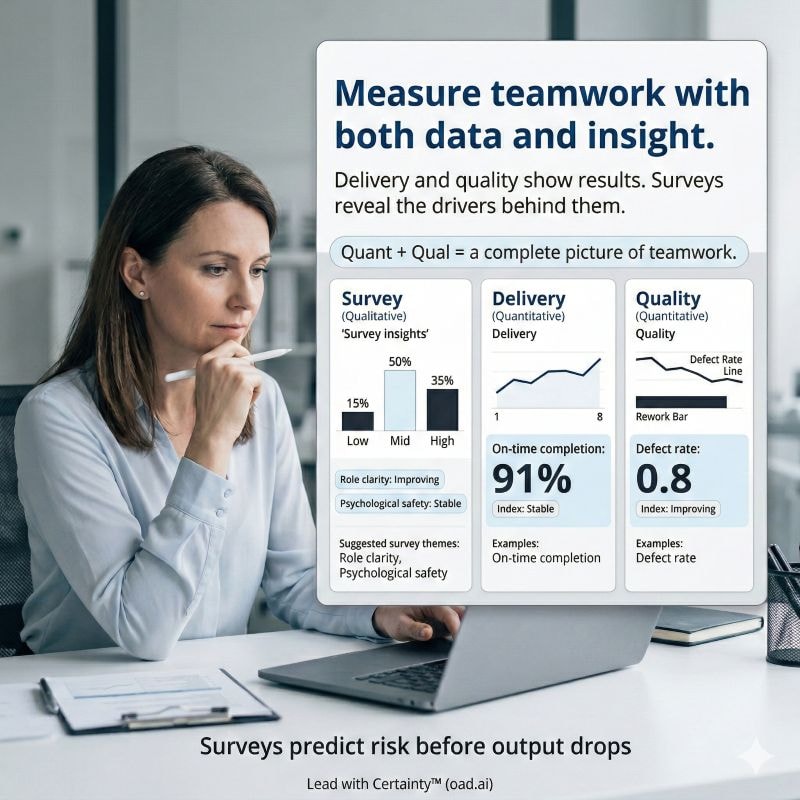
Qualitative Measures That Create Valuable Insights
Quantitative metrics tell you what happened. Qualitative insights tell you why. If you skip the “why,” you end up chasing symptoms: more meetings, more reporting, more pressure, less progress.
Qualitative measures are also where teams mess up by being vague. “How’s it going?” is not a system. Structure it.
Anonymous pulse surveys for employee engagement and psychological safety
Pulse surveys work when they are short, frequent, and acted on. If you survey people and do nothing, engagement drops harder because now you’ve added disappointment to the workload.
Run a pulse survey every 2–4 weeks. Keep it to 5–8 questions. Focus on team dynamics that predict team success:
- “I know what success looks like this week.”
- “Blockers get removed quickly.”
- “We can raise opposing opinions without punishment.”
- “Responsibilities are clear across team members.”
- “I can do high-quality work at a sustainable rate.”
Use a consistent scale, and track trends. The trend is the point.
Structured one-on-ones and feedback loops
One-on-ones are measurement tools when you stop treating them like therapy or status updates.
Use a simple structure:
- What’s slowing you down right now?
- Where is the team not on the same page?
- What decision are we avoiding?
- Where do you see skill gaps or missing support?
- What should we start, stop, continue?
Capture themes, not gossip. Then feed themes back into process fixes, goal clarity, and skill development planning.
This is also where you catch personal circumstances early and handle them like adults, not like liabilities. Giving people individual access to their own assessment insights reinforces ownership, while support and clarity beat surprise underperformance every time.

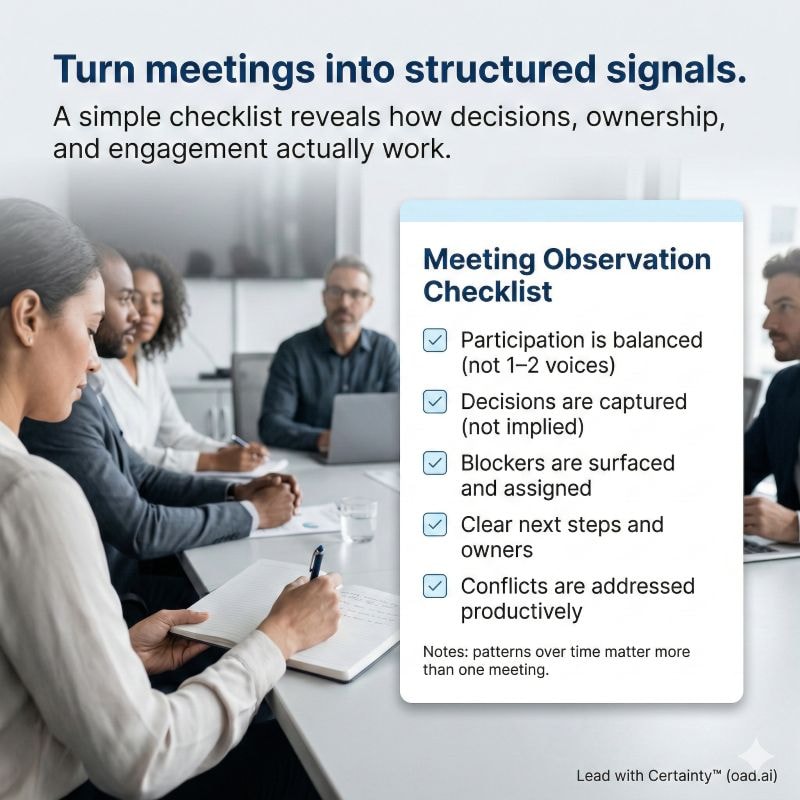
Meeting participation and decision quality
Meetings create signals. Most teams ignore them until everything is broken.
Observe:
- Who speaks, who doesn’t, and whether silence comes from disengagement or fear.
- Whether team meetings end with decisions, owners, and deadlines.
- Whether the same issues repeat (a sign of poor decision making or weak follow-through).
- Whether new members can participate or get steamrolled.
A team can have “active” meetings and still be dysfunctional. Participation matters, but decision quality matters more.
If you want a simple metric, track:
- % of meetings with documented decisions and owners
- average age of unresolved decisions
- number of recurring agenda items that never get resolved
Measuring Team Dynamics and Collaboration Patterns
This is where you stop pretending teamwork is just “people being nice” and start measuring what actually drives team effectiveness: how work moves, how decisions get made, how conflict gets handled, and whether people actually fit the culture you’re hiring for using behavioral interview questions for cultural fit.
Do this carefully. The point is to improve collaboration, not create a surveillance culture that makes everyone defensive and less honest.
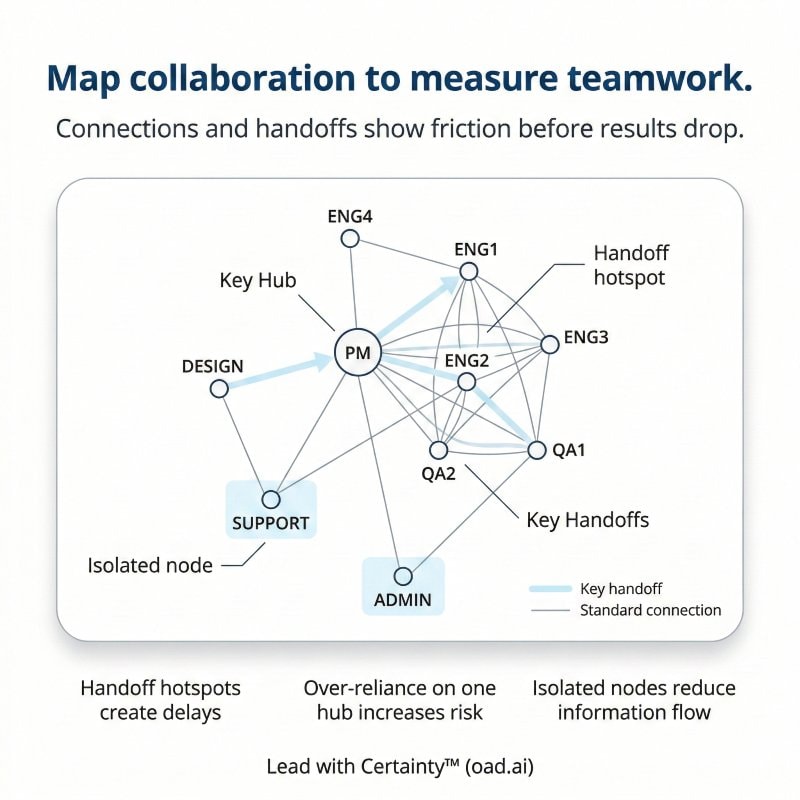
Mapping collaboration and information flow (who works with whom, and who is blocked)
You don’t need creepy monitoring software. You need a basic picture of collaboration patterns:
- Who is a bottleneck because everything routes through them?
- Who is disconnected and underutilized?
- Where do handoffs fail repeatedly?
- Which roles create delays because responsibilities are unclear?
Practical ways to map this without spying:
- Review handoffs in project tools (tickets moving back and forth, blockers logged).
- Ask the team directly in retrospectives where work gets stuck.
- Track blocker aging by category (dependency, unclear scope, approval delays, skill gaps).
If a team depends on one “hero” to unblock everything, that is not team success. That is fragility with a nice title.
Peer-to-peer recognition as a signal (and its limits)
Peer recognition can be a useful signal of visible contribution and collaborative efforts, especially in cross-functional teams. It can also become a popularity contest.
Use it as directional input, not a performance score.
Track:
- frequency of recognition events
- distribution (is it shared, or focused on the same few people?)
- what behaviors are being recognized (helping others, quality, ownership)
If recognition is low, it might mean low morale, low psychological safety, or simply a culture that doesn’t do recognition. If recognition is high but performance is weak, it might mean the team is bonding while avoiding accountability.
Conflict patterns: opposing opinions vs. recurring dysfunction
Healthy teams disagree. Weak teams either avoid conflict or recycle the same conflict forever.
Track conflict as themes, not personalities:
- What topics keep triggering tension? Priorities, roles, standards, workload, too many leaders.
- Does conflict get resolved into decisions, or does it leak into side conversations?
- Do disagreements improve the work, or stall it?
A simple “conflict flag” system can work:
- recurring issue logged
- owner assigned (team leader or facilitator)
- next action defined (clarify responsibilities, reset meeting goals, define decision rights, coaching)
If the same conflict repeats after multiple attempts, it usually signals either unclear structure or stable behavior mismatches across team members. That’s where structured assessment can help diagnose patterns objectively, instead of labeling people as “difficult” and hoping the problem disappears.
Tools and Methods for Measuring Teamwork
Tools don’t fix measurement. Tools scale whatever you’re already doing. If your metrics are sloppy, dashboards just make the sloppiness look official.
The goal is simple: collect data with minimal friction, keep it visible, and make sure it leads to action.
Dashboards that show an accurate picture without vanity metrics
A useful dashboard is boring on purpose. It answers a few questions fast:
- Are we making progress toward meeting goals?
- Are we delivering on time?
- Is quality holding?
- What is stuck, and why?
- Is the team environment improving or deteriorating?
Design rules:
- show trends, not single numbers
- include 6–10 metrics max
- separate team performance from team member performance
- avoid “activity metrics” like hours logged as a proxy for value
If you add too much, executives stop reading and teams stop caring.
Project tools for blockers, handoffs, and “same page” status
Your project tool is already collecting measurement signals, if you use it consistently.
Log:
- task statuses (not just “in progress,” but “blocked,” “waiting,” “needs review”)
- blockers with a short category tag
- handoff points (who needs to review or approve)
- ownership clearly (one owner per deliverable)
This gives you quantitative data without extra reporting. It also forces clarity across team members and reduces the classic failure mode: everyone assumes someone else owns the task.
Time tracking for attendance and punctuality (use it carefully)
Attendance and punctuality matter when they affect delivery and collaboration. They become toxic when you treat them like morality.
Use time and attendance data only when:
- poor attendance is disrupting handoffs
- team meetings regularly start late or lack key roles
- punctuality issues cause repeated delays
If you track it, track patterns, not single events. Pair it with context. Personal circumstances happen. The measurement goal is operational clarity, not punishment, especially in high-stakes environments like post-acquisition private equity portfolios.
If attendance is a recurring issue across many people, it often signals workload overload, low engagement, unclear priorities, or poor management practices, not just “lazy employees.”
A shared repository for qualitative observations (simple, structured, defensible)
Qualitative notes become useful when they are structured and aggregated. Otherwise, they become biased stories.
Create a shared repository where managers or team leads capture themes from:
- retrospectives
- one-on-ones (themes only)
- project post-mortems
- onboarding feedback from new members
Keep it structured:
- issue theme (clarity, workload, quality standards, decision rights, collaboration)
- example in neutral language
- impact on performance
- proposed action and owner
This creates a clear understanding of what’s actually happening inside the team, and it makes improvement work traceable instead of political.
Surveys, Observations, and Meetings for Measuring Teamwork
This is the “human layer” of measurement. Done right, it fills the gaps metrics cannot touch by surfacing patterns in areas like communication skills and interaction quality. Done wrong, it becomes vibes-based management with a clipboard.
The rule: use surveys for trends, observations for behavior patterns, and meetings for decisions.
Design survey questions focused on team dynamics
Most surveys fail because the questions are too broad. “Do you feel supported?” gets you poetry, not data.
Design questions that connect directly to team effectiveness and performance. Examples:
- Clarity: “I know what my priorities are this week.”
- Ownership: “Responsibilities are clear across team members.”
- Collaboration: “When I need help, I can get it quickly.”
- Psychological safety: “I can raise concerns or opposing opinions without negative consequences.”
- Execution: “We follow through on decisions made in team meetings.”
Keep responses simple (a scale plus one optional comment). Run them consistently. Track change over time.
One important boundary: don’t treat survey scores as “proof” someone is a bad leader. Treat them as an indicator to investigate what’s happening in the team environment.
Train observers to record interaction quality
Observation sounds fancy. It’s actually simple: someone watches how work and communication happen and writes down what they see, in neutral terms.
This is useful when:
- the team is struggling but metrics do not explain why
- meetings are unproductive
- there are recurring conflicts
- new members are not integrating
Train observers (team lead, HR partner, facilitator) to look for specific signals, similar to how behavioral tools for data-driven coaching help leaders see patterns clearly:
- Do people come well prepared?
- Are decisions made, or endlessly deferred?
- Do too many assertive leaders compete for control?
- Does one person dominate while others disengage?
- Are blockers surfaced early, or hidden until deadlines collapse?
- Does disagreement improve outcomes, or create avoidance?
Rules:
- record behaviors, not personality judgments
- focus on patterns, not one-off moments
- share findings as team-level themes, not individual callouts
This protects trust while still giving you a clear understanding of what’s actually happening.
Schedule retrospectives to review meeting goals and performance
Retrospectives are where measurement turns into improvement. Without retrospectives, metrics become passive reporting.
A simple monthly retro format:
- What improved since last month?
- What got worse?
- What blocked progress most often?
- Which metric is most out of line with our shared goals?
- What one change will we test next month?
Retrospectives also stop “dashboard theatre.” If a number is bad, the team should agree on why, what to try, and how they’ll measure impact.
If the team cannot discuss metrics honestly, you have a psychological safety problem. Fix that before you add more measurement.
Turning Metrics Into Informed Decisions
Metrics are worthless until they change decisions. Otherwise you’re just building a museum exhibit called “Data We Collected While Nothing Improved.”
The point is to identify areas that matter, choose one change, test it, and measure whether it helped.
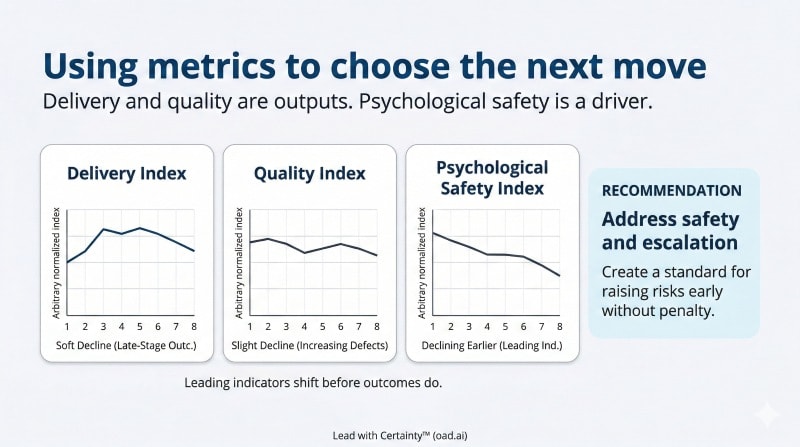
Trend analysis: identify areas of improvement and the team’s strengths
Look at trends over 8–12 weeks. Weekly noise is not the story.
Start with three questions:
- What is improving?
- What is stable but not good enough?
- What is deteriorating?
Then link signals across categories. Examples:
- On-time delivery drops while blocker aging rises: the system is stuck, not lazy.
- Defect rate rises while throughput rises: speed is being bought with quality.
- Engagement drops while meeting load rises: coordination overhead is crushing focus.
- Participation drops while decisions stall: psychological safety or unclear authority is likely.
Also document team’s strengths. Teams perform better when they can protect what’s working instead of only being “fixed.”
Run small experiments and measure impact
Big “transformation” plans fail because they are vague and unmeasurable. Run small experiments instead.
A good experiment has:
- one change
- one owner
- a short time window (2–4 weeks)
- a clear metric tied to the goal
Examples:
- Reduce meeting load by 20% and measure throughput, blocker aging, and pulse survey clarity.
- Add explicit handoff criteria and measure rework rate and cycle time.
- Clarify decision rights (who decides what) and measure decision aging and delivery reliability.
If the metric doesn’t move, either the change was wrong or you implemented it inconsistently. Both are useful conclusions.
Present recommendations leadership can act on
Executives want clarity, not a metric dump, especially founders and CEOs who are making high-stakes hiring and leadership decisions for growth.
Use a simple structure:
- The problem: what the trend shows
- The impact: what it’s costing (time, quality, turnover risk, missed goals)
- The likely cause: what patterns suggest
- The recommendation: 1–3 actions max
- The measurement plan: what will change if it works
Avoid blaming individuals unless there is clear evidence and role clarity is already strong. Most performance problems are system problems first.
This is where assessment tools can add real value when used correctly: they help explain stable behavior patterns that affect collaboration and execution, and they help you build teams with complementary strengths instead of accidental friction. That’s a better lever than endless “communication workshops” that solve nothing.
Meeting Goals and Accountability Without Toxicity
Accountability is not shouting “ownership” in meetings. It’s a system that makes responsibilities visible, decisions clear, and follow-through normal. The fastest way to destroy teamwork is to measure people aggressively while keeping goals vague.
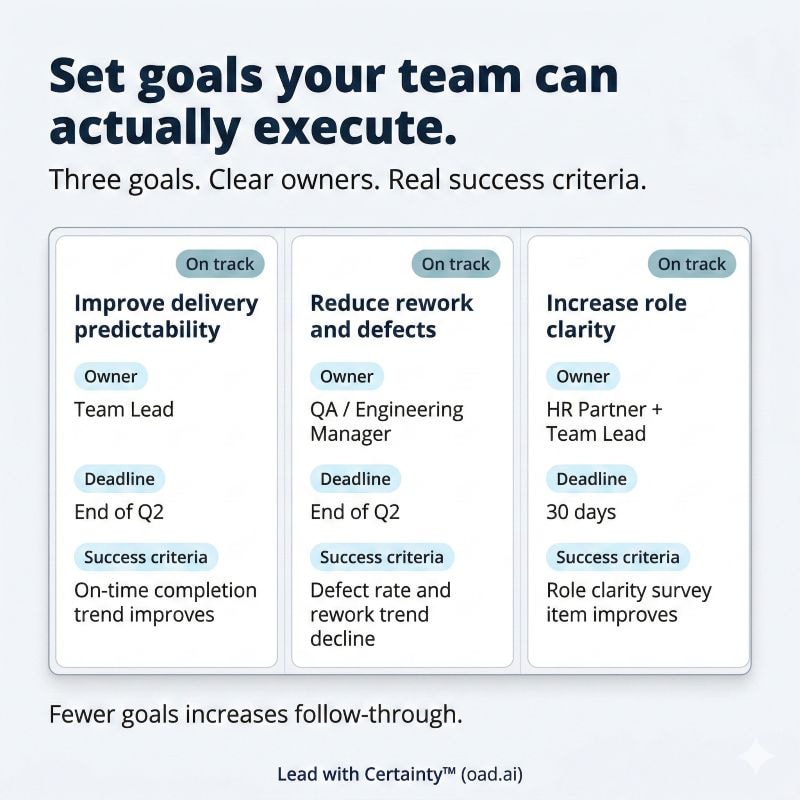
Set measurable team goals with deadlines
Team goals should be measurable, time-bound, and tied to outcomes the team can actually influence.
A useful team goal includes:
- the outcome (what changes)
- the deadline
- the success measure (how you’ll know)
- the owner (one person accountable for coordination)
- the constraints (capacity, dependencies, budget)
Examples (generic, but functional):
- “Reduce rework rate from X to Y by end of quarter by tightening review criteria and handoffs.”
- “Improve on-time delivery to Z% for planned work by week 12 by reducing blocker aging and clarifying dependencies.”
- “Increase clarity score in pulse survey by N points by implementing weekly priority alignment and cutting meeting load, especially in critical functions like building and leading high-performing sales teams.”
If you cannot describe the goal in one sentence, it’s not a goal. It’s a wish.
What to do when goals are missed (support, constraints, consequences)
When goals are missed, teams need two things: clarity and fairness. Most organizations offer neither.
A practical approach:
- Confirm whether the goal was realistic
Were deadlines and scope achievable at a sustainable rate? If not, fix planning. - Identify the constraint
Common constraints: unclear priorities, dependencies, skill gaps, poor attendance patterns, decision bottlenecks, too many leaders, lack of resources. - Choose the response
- If it’s a system constraint: adjust process, decision rights, workload, staffing.
- If it’s a capability gap: create a skill development plan, coaching, training, better support.
- If it’s a repeated behavior issue with clear role expectations: set consequences, but document and act consistently.
Accountability without support creates fear. Support without accountability creates drift. You need both, and you need them applied predictably.
This is also why behavior fit reports that match roles to personality can be useful in hiring and internal mobility: they reduce the guesswork about fit, working style, and the behaviors that predict whether someone will thrive in a specific team environment.
Getting Started: A 90-Day Plan to Measure Teamwork
If you try to implement everything at once, you’ll get the usual result: a burst of enthusiasm, a dashboard, and then silence. This plan keeps it lean enough to survive real life.
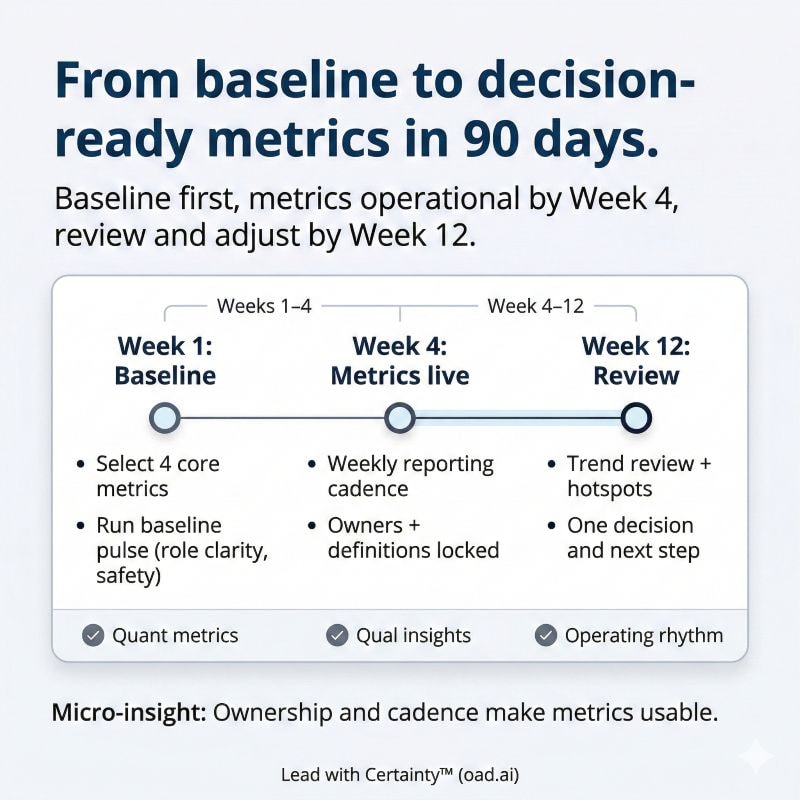
Week 1: Run a baseline assessment
Your baseline is not just numbers. It’s a snapshot of delivery, quality, collaboration, and team environment.
In week one, do four things:
- Define “team success” for this team
Write it down in plain language. Tie it to shared goals and business outcomes. - Choose your initial metric set (6–10 max)
Include at least:
- one delivery metric (on-time delivery or throughput)
- one quality metric (rework or defect rate)
- one collaboration metric (blocker aging or handoff friction)
- one health metric (pulse survey trend)
- Run a short pulse survey
5–8 questions max. Capture employee engagement and psychological safety signals. - Review your last 4–8 weeks of delivery and quality data
Pull from project tools. Don’t over-engineer it. You just need an accurate picture.
By week 4: Implement the right metrics with an operating rhythm
This is where measurement becomes normal instead of performative.
By week four, you should have:
- A dashboard visible to the team (and leadership, if appropriate)
- Metric owners assigned for each key metric
- A weekly 15-minute review cadence
- Clear definitions for each metric (so nobody argues about what it means)
The weekly review agenda should be painfully simple:
- What moved?
- What got stuck?
- What decision do we need?
- What one action are we taking next?
If your weekly review turns into a debate about whose fault something is, your measurement system is broken. Fix the system, not the people.
By week 12: Review results, adjust metrics, and lock the system
At week 12, you should have enough data to see patterns. This is when you refine.
Do a 60–90 minute review:
- Which metrics actually helped decision-making?
Keep those. - Which metrics created noise or bad incentives?
Drop or redefine them. - What improved, and what didn’t?
Tie it back to the experiments you ran. - What’s the next bottleneck?
Pick the next improvement focus.
You also decide whether to expand measurement. Only expand if the team can handle it and the current system is being used consistently.
A good measurement system is boring, stable, and effective. Humans hate that, which is why it works.
FAQ: How Do You Measure Teamwork?
How to measure teamwork performance?
Measure teamwork performance with a small set of metrics across four areas: delivery (on-time, throughput), quality (rework, defects), collaboration (blockers, handoffs), and team health (pulse survey trends). Review trends monthly, not one-off spikes, and tie the data to one or two improvement experiments at a time.
What are the three standard ways to measure teamwork?
- Outputs: what the team delivers (speed, quality, outcomes)
- Behaviors: how work gets done (ownership, follow-through, handoffs)
- Team dynamics: how people function together (psychological safety, conflict handling, decision quality)
A workable system uses all three, because any single category can mislead you.
What are the 5 C’s of effective teamwork?
Different sources define this differently, so treat it as a practical checklist rather than a universal law. A usable version is:
- Clarity (roles, priorities, success criteria)
- Communication (fast alignment, no ambiguity)
- Collaboration (smooth handoffs, mutual support)
- Commitment (follow-through on decisions)
- Conflict handling (productive disagreement without dysfunction)
If your metrics never surface breakdowns in these areas, you are missing the real drivers of team effectiveness.
How can teamwork be evaluated?
Evaluate teamwork by combining quantitative performance metrics with structured qualitative measures. Use dashboards and project data to track delivery and quality. Use pulse surveys, structured one-on-ones, and retrospectives to explain why results are happening and what to change next.
What metrics show psychological safety on a team?
Psychological safety is best tracked through short pulse survey trends, not “observed vibes.” Useful signals include whether people feel safe raising concerns, whether opposing opinions are heard, whether mistakes can be discussed without blame, and whether decisions can be challenged. Treat the trend as an early warning system, then validate with what you see in meetings and retrospectives.
How do you measure collaboration without spying on employees?
Measure collaboration through work signals, not surveillance. Track blocker aging, handoff friction, decision follow-through, and rework patterns from existing tools. Add lightweight retrospectives to identify where collaboration breaks down. Avoid individual-level monitoring unless roles are stable and the team already trusts the process.
Conclusion: Choose Metrics That Improve Performance, Not Just Track It
Measuring teamwork works when it stays simple: define team success, pick a small set of key metrics, review trends, and run small experiments that improve performance. The goal is not a perfect dashboard. The goal is better decisions, stronger execution, and a team environment that supports sustainable results.
If you want to reduce guesswork further, the missing piece is often fit and behavior patterns. Teams usually struggle not because they lack effort, but because roles, working styles, and decision behaviors are misaligned. That is where a structured, science-based assessment approach helps.