Teams are where work gets done. Plans do not ship products. People do.
That is why measuring team effectiveness matters. If you do not measure it, you guess. And most leaders guess based on the wrong signals.
They notice who talks most in meetings. Who looks busy. Who seems “aligned.” Those signals can fool you, especially in complex roles or cross-functional work.
A simple measurement system helps you see what works and what breaks under pressure. It also shows where to improve team dynamics without turning every issue into a personal argument.
Table of Contents
- What “team effectiveness” means (and what it does not)
- Why measuring team effectiveness matters for leaders
- Start with context before you measure anything
- A practical model for measurement (so metrics don’t become random)
- Step 1: Define success in plain language
- Step 2: Choose a balanced set of team effectiveness metrics
- Step 3: Measure team dynamics, not just results
- Step 4: Pick the right measurement methods
- Step 5: Build a review cadence that drives action
- Common mistakes when measuring team effectiveness
- FAQ: Measuring Team Effectiveness (People Also Ask)
- Conclusion: A simple operating system for continuous improvement
What “team effectiveness” means (and what it does not)
People use “team effectiveness” as a catch-all term. That makes it hard to measure. So start with a clear definition.
A team is effective when it delivers results and can keep doing it. Not just once. Not only when everyone is in a good mood. Not only when one person saves the day.
An effective team can hit goals without:
- burning people out
- letting quality slip
- relying on constant overtime
- fixing the same problems again and again
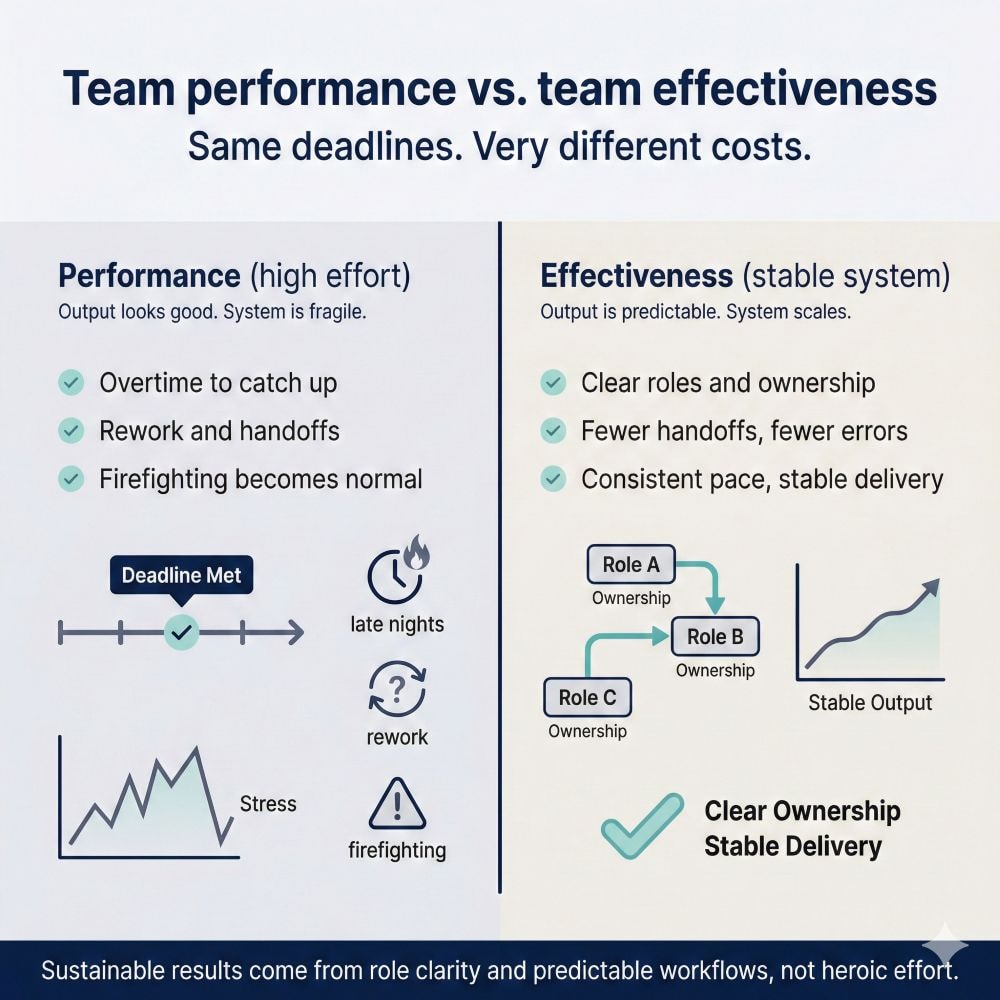
Team effectiveness vs team performance
Team performance is the result you got. Did the team hit the deadline? Did revenue go up? Did the project ship?
Team effectiveness is how reliably the team can produce strong results over time. It includes performance, but it also includes how the team works.
An effective team can:
- coordinate work without constant escalation
- adjust fast when priorities change
- handle conflict without losing trust
- keep quality steady as the workload grows
This difference matters. Some teams look “high performing” for a while. Then they crash. They hit targets through long hours, unclear ownership, and rework. That is not effectiveness. That is a short-term sprint.
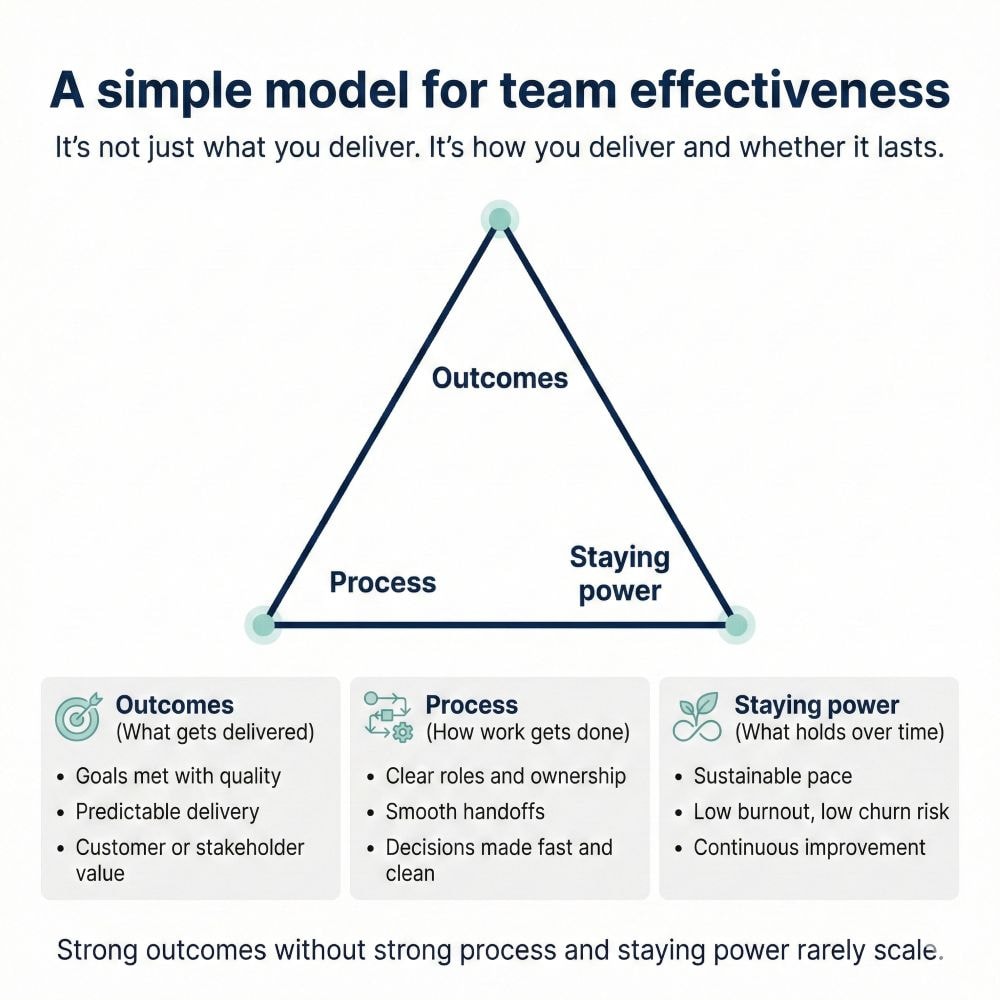
Outcomes, process, and staying power
To measure team effectiveness, separate three things. Most teams mix them together.
1) Outcomes (results)
What the team produced. Examples: projects finished, tickets solved, sales closed, service levels met.
2) Process (how work happens)
How the team plans, shares info, and makes decisions. Examples: handoffs, clear roles, decision speed, meeting load.
3) Staying power (can they keep going)
Whether results are repeatable. Examples: burnout risk, turnover rates, psychological safety, and error trends when things get busy.
If you only measure outcomes, you learn the truth late. Outcomes show you what already happened. Process and staying power show you what will happen next.
One quick test: if results depend on one person, constant urgency, or “we’ll fix it later,” effectiveness is already dropping. You just have not felt the impact yet.
Why measuring team effectiveness matters for leaders
Leaders usually measure what is easiest to count. Output. Deadlines. Tickets closed. Revenue. That is useful, but it is not enough.
A team can hit numbers and still be a mess behind the scenes. When that happens, problems build quietly until they show up as missed goals, customer issues, or sudden turnover.
Measuring team effectiveness gives you earlier signals. It helps you act before the team pays the price.
[Image: Executive reviewing team metrics dashboard with early-warning indicators (quality drift, rising meeting load, engagement drop). Alt: “Team effectiveness metrics used for data-driven decisions”]
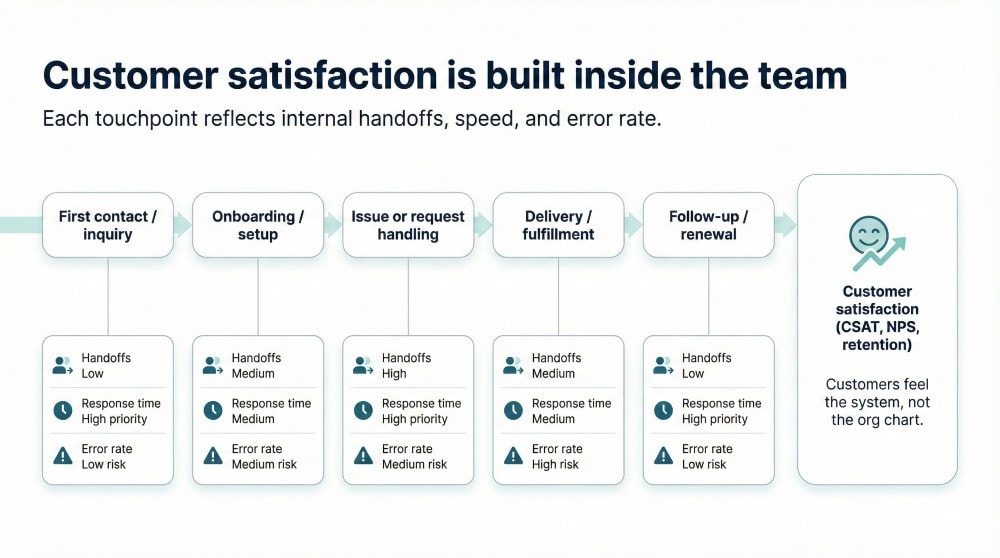
Links to quality, speed, risk, and customer satisfaction
Team effectiveness shows up in business outcomes that leaders actually care about.
- Quality: Effective teams make fewer avoidable mistakes. They also catch issues earlier, before they become rework.
- Speed: Clear roles and faster decisions reduce delays. Work moves without constant back-and-forth.
- Risk: When ownership is fuzzy, risks get missed. Effective teams surface problems early and take smart action.
- Customer satisfaction: Customers feel the difference. A smooth internal process often leads to a smoother external experience.
You do not need a perfect system to start. Even a small set of metrics can show if a team is improving or sliding.
The cost of guessing
When leaders do not measure, they fill gaps with stories.
- “This team is strong, they always deliver.”
- “That team is slow, they need better people.”
- “She is the problem.”
- “They just need to communicate more.”
Sometimes those stories are true. Often, they are not. Teams are systems. If the system is broken, even good people struggle.
Guessing also creates bad incentives. People learn what gets praised. They optimize for appearance.
They send more messages. They attend more meetings. They stay online longer. Output does not improve, but everyone looks busy.
A better approach: measure to improve, not to police
Measurement fails when it feels like surveillance. People hide mistakes. They stop taking risks. They give you safe answers.
A better goal is simple: use measurement to make decisions. Not to punish people.
If you do it right, metrics help a team answer questions like:
- Where are we losing time each week?
- What causes rework?
- Are we relying on one person too much?
- Are team meetings helping, or just consuming hours?
- Is workload rising faster than capacity?
When measurement points to a problem, the fix is usually not “work harder.” It is clearer priorities, better handoffs, tighter roles, and fewer pointless loops.
How OAD fits in this process
A lot of team issues are not about effort. They are about fit and working style.
Two people can both be smart and still clash. One wants fast decisions. One wants more detail. One is direct. One is cautious. The team wastes time on friction that no one names.
That is where structured assessment helps. OAD can support team decisions by making work styles visible and measurable.
It can help leaders:
- build healthier team composition
- reduce mismatch in key roles
- improve collaboration by setting clear expectations
Used well, assessment does not label people. It reduces guessing.

Start with context before you measure anything
Most measurement fails for one dumb reason: leaders copy metrics from another team.
A sales team, a customer support team, and a product team do not work the same way. If you measure them the same way, you will “prove” the wrong things. Then you will fix the wrong things.
Start by defining the team’s context. That tells you what to measure and what to ignore.
Team type: what kind of work does this team do?
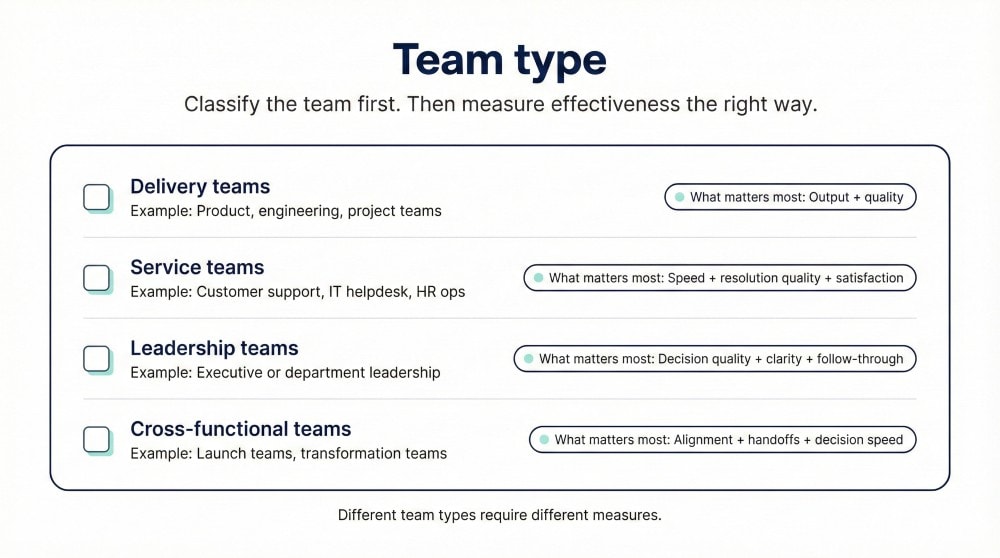
Before you choose metrics, name the team type in plain language. Most teams fit into one of these patterns:
- Delivery teams (product, engineering, project teams)
They build or ship work. Output and quality matter most. - Service teams (customer support, IT helpdesk, HR ops)
They handle requests. Speed, resolution quality, and customer satisfaction matter most. - Leadership teams (exec or department leadership)
They make decisions. Decision quality, clarity, and follow-through matter most. - Cross-functional teams (launch teams, transformation teams)
They coordinate across groups. Alignment, handoffs, and decision speed matter most.
This step prevents metric confusion. For example, a leadership team does not “produce” tickets. A service team does not “ship” features. The work is different.
Task interdependence: how much do people rely on each other?
Some teams can work in parallel. Others cannot.
When work is low interdependence, individual output tells you a lot. People can complete tasks with minimal coordination.
When work is highly interdependent, team dynamics matter more than individual effort. Handoffs, timing, and shared decisions shape the result.
Signs of high interdependence:
- frequent handoffs between roles
- shared ownership of outcomes
- work that changes midstream
- decisions that affect multiple people at once
If a team is highly interdependent, measuring team effectiveness without measuring collaboration is pointless. You will miss the real bottleneck.
Time horizon: what does “good” look like this week vs this quarter?
Teams live in different time windows. Your measurement should match that.
- Weekly view (operations):
Are we on track right now? Are issues growing? Is meeting load rising? Is quality drifting? - Monthly or quarterly view (outcomes):
Are we hitting team goals? Are customers happier? Are turnover rates changing? Is the team improving?
If you only measure quarterly outcomes, you find problems late.
If you only measure weekly activity, you reward motion instead of results.
The fix is simple: use a small weekly scorecard plus a deeper monthly review.
A practical model for measurement (so metrics don’t become random)
If you collect a pile of metrics, you will get a pile of confusion. Teams end up tracking what is easy, not what matters.
You need a simple model that keeps measurement focused. Not academic. Not a 40-slide framework. Just enough structure to pick the right signals and act on them.
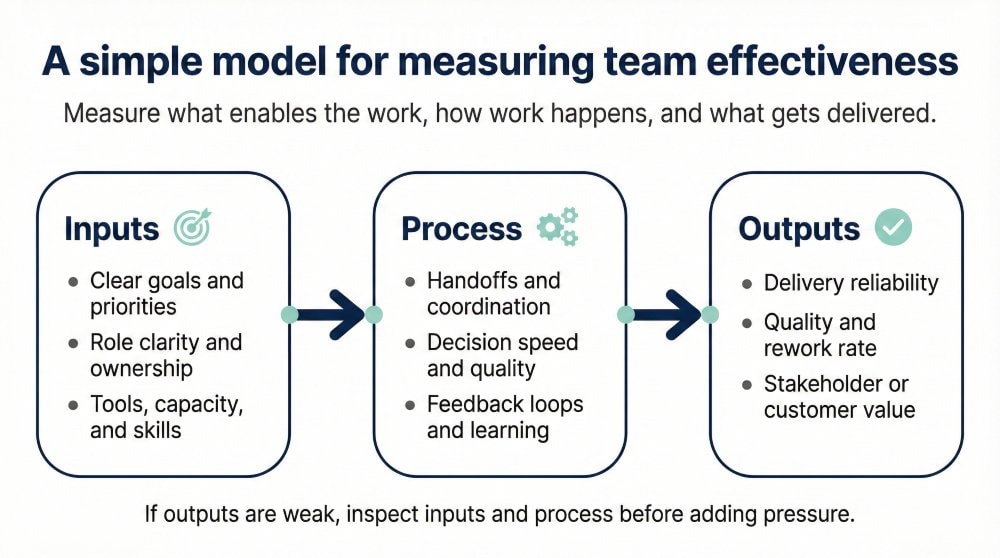
Input–Process–Output logic (simple version)
Most teams can be measured with three buckets:
Inputs (what the team starts with)
What the team is given. Examples: team composition, skills, tools, workload, clarity of goals.
Process (how the team works)
How work flows through the team. Examples: communication, decision-making, handoffs, role clarity, psychological safety.
Outputs (what the team produces)
The results. Examples: delivery, quality metrics, customer satisfaction, team performance against goals.
Why this matters: outputs are often the last thing to change. Process signals shift earlier.
If delivery drops, leaders often blame effort or talent. But the cause is often a process issue: unclear ownership, slow decisions, or too much rework.
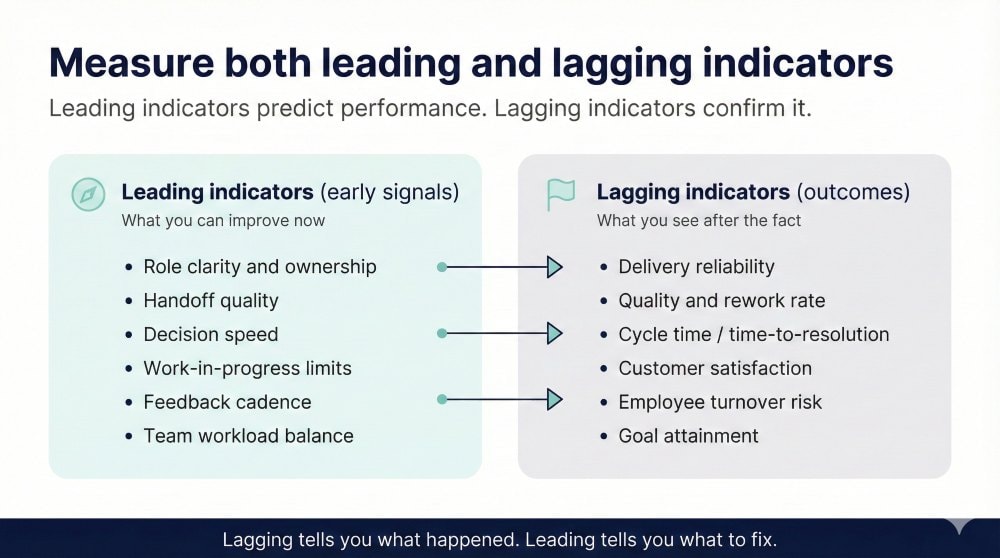
Leading vs lagging indicators (what you can actually change)
Not all metrics are equal. Some tell you what already happened. Others warn you early.
Lagging indicators are the final result. They are important, but late:
- customer satisfaction scores
- quality metrics like defect rate
- missed deadlines
- turnover rates
Leading indicators shift first. They are closer to daily behavior:
- decision time (how long choices take)
- rework volume (how often work is redone)
- handoff delays
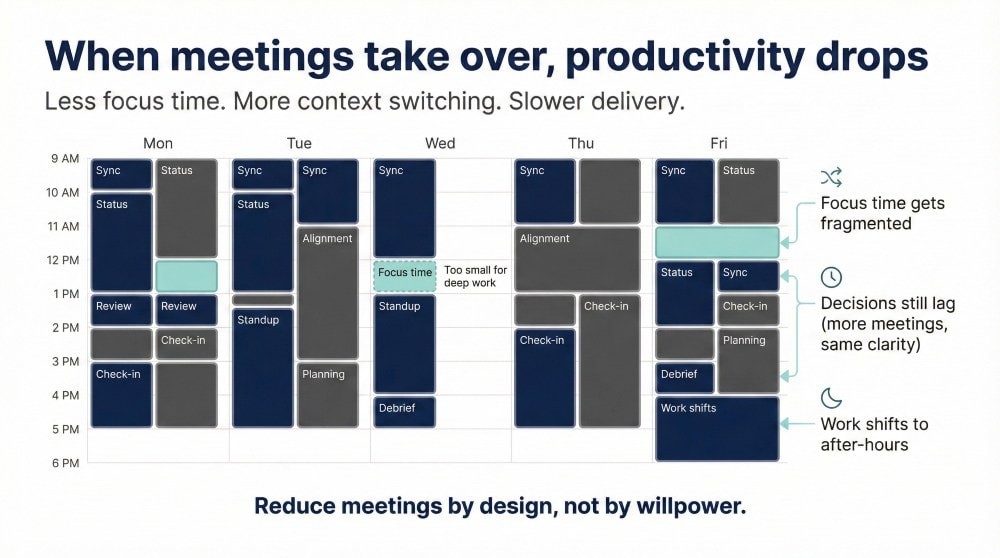
- meeting load and time fragmentation
- clarity of priorities (do people know what matters this week?)
A balanced system uses both. Lagging indicators confirm outcomes. Leading indicators tell you what to fix now.
One caution: “activity” is not always a leading indicator. More meetings can be a warning sign, not a success signal.
Step 1: Define success in plain language
This is the part most teams skip. They jump straight to tracking numbers. Then they argue about what those numbers mean.
Defining success first makes measurement easier. It also keeps the team from optimizing the wrong thing.
Team goals, shared goals, and what “good” looks like
Start with 3 layers. Keep each one short.
1) Outcome goal (what you must deliver)
Examples:
- “Ship X feature by Y date with no critical defects.”
- “Resolve 90% of priority tickets within 48 hours.”
- “Reduce onboarding time for new hires by 20%.”
2) Quality bar (what ‘good’ means)
Examples:
- “Less than X% rework.”
- “Audit pass rate stays above X.”
- “Customer complaints do not rise as volume increases.”
3) Team operating rules (how you work together)
Examples:
- “Decisions are made within 48 hours once the owner is clear.”
- “Every task has one accountable owner.”
- “Blockers are raised within one business day.”
That third layer matters. It turns teamwork into observable behavior. It also makes team dynamics measurable.
Guardrails: quality, compliance, wellbeing, and customer impact
Teams often hit targets by breaking something else.
- They rush and quality drops.
- They cut corners and compliance risk rises.
- They push overtime and people burn out.
- They chase speed and customer satisfaction falls.
So add guardrails. Guardrails are non-negotiables. They stop “success” from becoming a trap.
Common guardrails to include:
- Quality metrics: defects, error rate, rework
- Compliance: audit findings, policy misses, safety incidents (where relevant)
- Wellbeing: sustained overtime, sick days, burnout risk signals
- Customer impact: CSAT, complaint volume, churn signals
This also protects leaders. If a team misses a goal, but stayed within guardrails, you have a clearer story. If they hit a goal by breaking guardrails, you can correct it early.
Step 2: Choose a balanced set of team effectiveness metrics
Once success is defined, metrics get easier. You are no longer asking, “What should we track?” You are asking, “What proves we are on track?”
Use a balanced set. If you only track output, teams learn to cut corners. If you only track engagement, teams can feel good while results slide.
A practical rule: pick a small number of metrics in each bucket. Then review trends, not single data points.
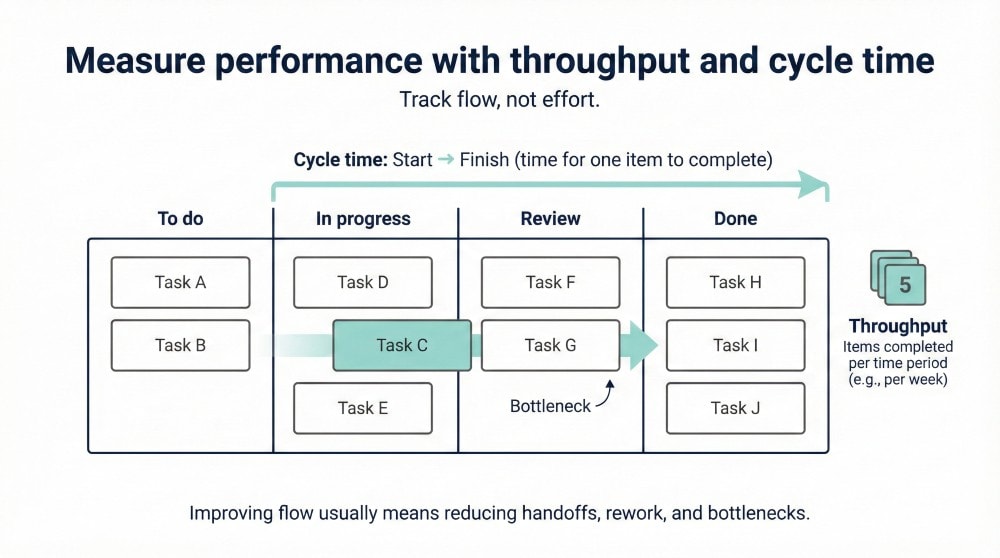
Output metrics (team’s output, delivery, throughput)
Output metrics show what the team produces. They work best when they match the team type.
Examples:
- Delivery teams: throughput, cycle time, on-time delivery rate
- Service teams: tickets resolved, first-response time, resolution time
- Sales teams: pipeline movement, deals closed, win rate
- Operations teams: volume processed, turnaround time, backlog size
Avoid making output a single number. Pair it with quality metrics, or you will reward speed over substance.
Quality metrics (defects, rework, error rate)
Quality metrics prevent the “ship now, regret later” pattern.
Examples:
- defect rate or escaped defects
- rework volume (how often work returns to a previous step)
- error rate in audits or QA
- customer-reported issues per period
- incident count or severity (for risk-heavy work)
Rework is often the most useful signal. It shows where the process is failing, not just where output is slow.
Customer metrics (customer satisfaction and downstream impact)
Customer metrics connect the team’s work to real value. They help teams avoid optimizing internal comfort at the expense of results.
Examples:
- customer satisfaction (CSAT)
- complaint volume and themes
- renewal or retention signals (where relevant)
- internal customer satisfaction (for shared services like HR or IT)
Use customer metrics carefully. Customer satisfaction can drop for reasons outside the team’s control. Track it, but interpret it with context.
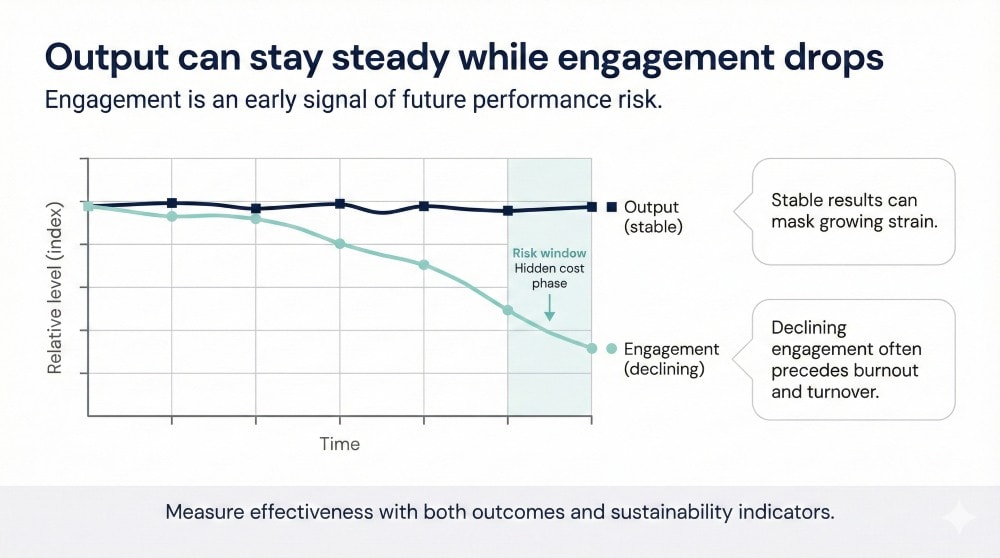
People metrics (engagement, job satisfaction, turnover rates)
People metrics are not “nice to have.” They predict stability.
Examples:
- employee engagement pulse results
- job satisfaction and team satisfaction
- absenteeism and sick days
- turnover rates, especially in key roles
- internal mobility (signals growth and fit)
If people metrics decline while output stays high, assume you are spending future performance. That is often the early warning sign.
Collaboration metrics (handoffs, decisions, and meeting load)
This is where many teams get blind. They measure what the team produces, but not what slows the team down.
Useful collaboration metrics:
- decision time for key calls
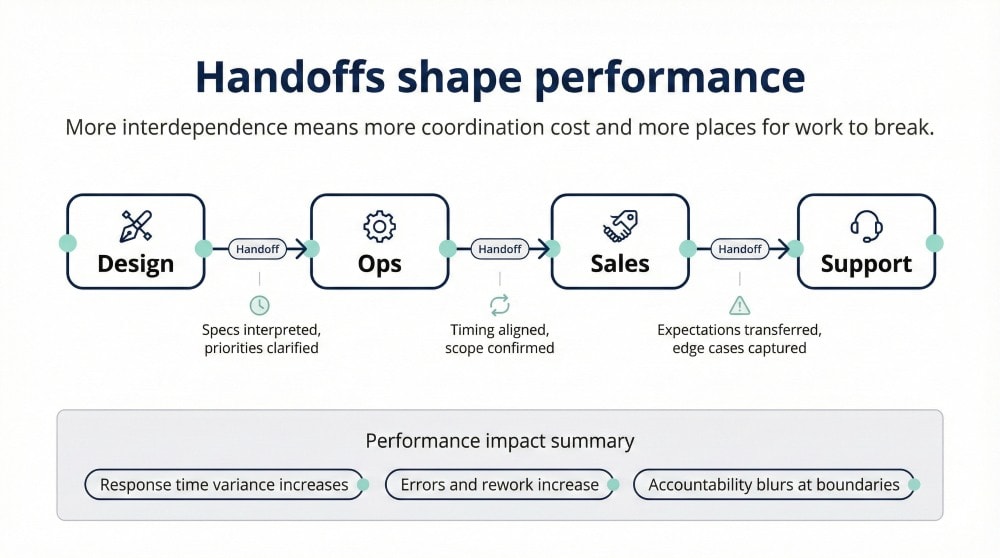
- number of handoffs per task (and where they fail)
- blocker time (how long work stays stuck)
- meeting hours per person per week
- interruptions and context switching (especially in knowledge work)
Meeting load is not evil. But rising meeting load often signals unclear roles or weak decision rules. It can also hide poor team dynamics, because meetings become a substitute for ownership.
Step 3: Measure team dynamics, not just results
Results tell you what happened. Team dynamics tell you why it happened and what will happen next.
Two teams can have the same output and very different futures. One is stable. One is one bad week away from falling apart.
Measuring team dynamics does not mean turning work into therapy. It means tracking a few human factors that drive coordination, speed, and quality.
Psychological safety (what it is, what it predicts)
Psychological safety is not “everyone is nice.” It is simpler than that.
It means people can:
- ask questions without being mocked
- admit mistakes without fear
- raise risks early
- disagree without payback
When psychological safety is low, problems stay hidden. People avoid speaking up. Errors show up later, when they are expensive.
You do not need a long survey to track it. A short pulse with a few clear items works well, as long as leaders act on what they learn.
Examples of simple survey items:
- “On this team, it is safe to speak up about problems.”
- “If I make a mistake, it is treated as a chance to learn.”
- “People here listen when someone raises a concern.”
If scores drop, look for the cause in behavior. Most of the time, it is how feedback and disagreement are handled in meetings.
Communication, trust, conflict, and accountability
Teams do not fail because they “lack communication.” They fail because communication has no structure.
What to measure:
- Clarity: Do people know priorities this week? Do they know who owns what?
- Trust: Do people follow through? Do they share information early?
- Conflict: Can the team disagree fast and then move on, or does conflict turn personal?
- Accountability: Are deadlines and standards clear, or does work drift until someone rescues it?
Good conflict is a sign of health. It means people care about outcomes. The problem is slow conflict. The kind that stays hidden, then explodes.
A useful check-in question for team meetings:
- “What is one decision we are avoiding right now?”
If the team cannot answer, decision rules are weak. If the same issue repeats, ownership is unclear.
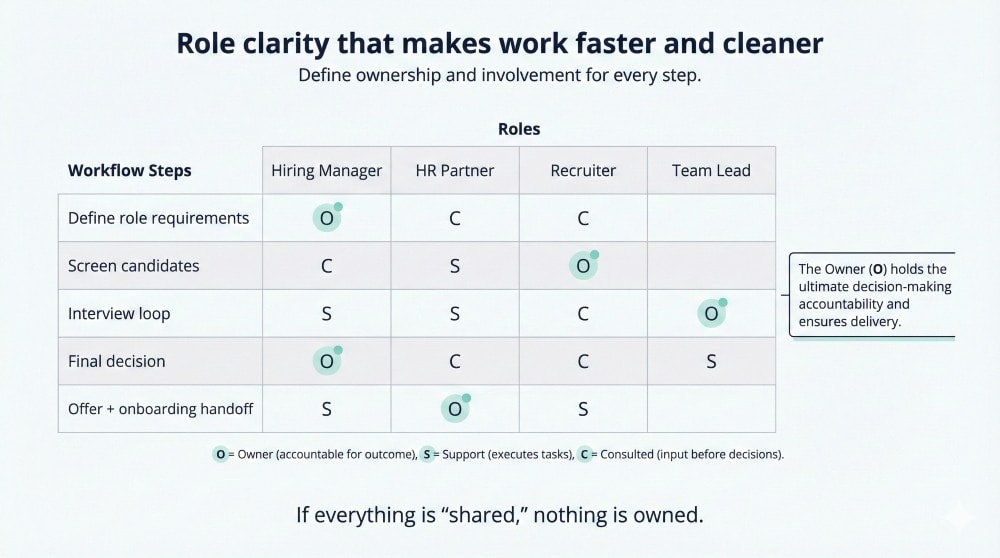
Role clarity and ownership (individual contributions inside shared work)
A lot of “team problems” are really ownership problems.
When roles are unclear:
- tasks bounce between people
- decisions get delayed
- meetings multiply
- the most responsible person becomes the default owner of everything
Role clarity is measurable. You can track it with:
- quick pulse questions (“I know what I am responsible for this week”)
- handoff failure rates (where work gets stuck)
- time spent in meetings to “align” instead of to decide
- workload imbalance (one person carrying key work repeatedly)
This is also where team composition matters. If you have gaps in key roles, no amount of “better communication” fixes it. The work still has nowhere to land.
Step 4: Pick the right measurement methods
Metrics are only as good as the way you collect them. Bad inputs create confident nonsense.
Use a mix of methods. Surveys tell you how people experience the team. Workflow data shows what actually happens. Reviews add context, if they are structured.
Surveys (what to measure, how to avoid garbage data)
Surveys work when they are short, specific, and used consistently.
What to measure in a team effectiveness pulse:
- psychological safety
- role clarity
- workload balance
- trust and follow-through
- decision speed and meeting usefulness
How to keep survey data useful:
- keep it short (5–12 items is often enough)
- run it on a steady cadence (monthly or quarterly)
- share results back to the team
- pick one action to improve, then track change
If you collect survey results and do nothing, scores will drop next time. People learn the system is fake.
Also: do not run “everything surveys” every month. Pulse surveys are for trends, not for writing a thesis on feelings.
Manager review, 360 feedback, and structured check-ins
Qualitative input matters. But only if it is structured.
A manager review becomes noise when it is:
- vague (“great attitude”)
- based on visibility instead of results
- mixed with personal preference (“not a culture fit”)
Structured check-ins work better. For example:
- What did we ship or finish this period?
- What slowed us down most?
- Where did handoffs fail?
- What decision took too long?
- Who is overloaded, and why?
360 feedback can help for leadership and collaboration, but keep it focused. Use it to spot patterns, not to litigate one person’s personality.
[Image: Simple review form with five structured questions and space for examples. Alt: “Structured management review for team effectiveness”]
Observation and workflow data (when quantitative measures beat opinions)
Some of the best team metrics come from work systems you already have.
Examples of workflow data:
- cycle time and backlog trends (delivery teams)
- first-response time and resolution time (service teams)
- rework loops and defect trends (quality)
- meeting hours per week (time use)
- decision latency (time from issue raised to decision made)
Observation is also valid, if it is disciplined. Watch for:
- who speaks and who stays silent
- whether decisions happen or drift
- whether meetings end with owners and next steps
- whether conflict is handled directly or avoided
When survey results and workflow data disagree, dig deeper. For example, output might be high while engagement is falling. That usually means the team is carrying hidden costs.
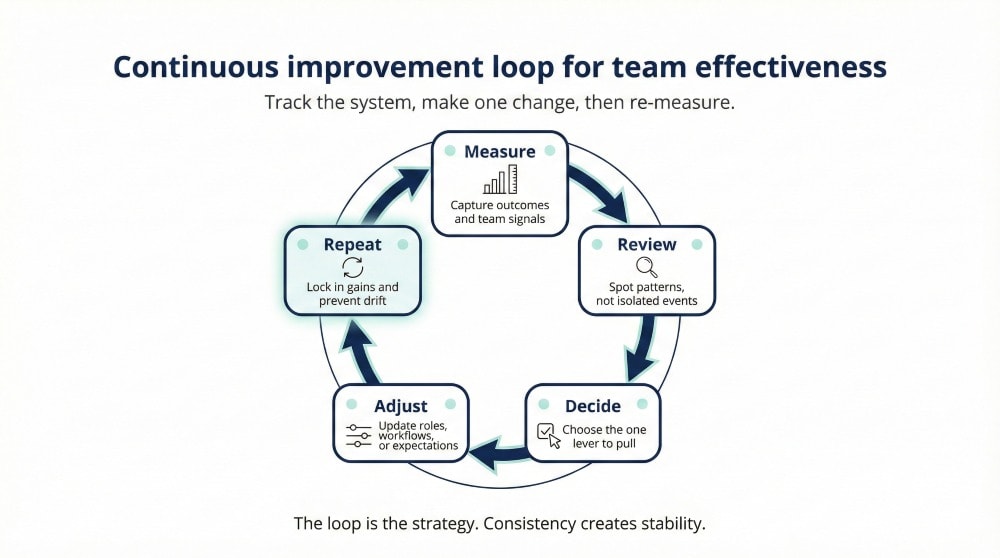
Step 5: Build a review cadence that drives action
Measurement is pointless if it does not change behavior. The fix is cadence.
A good cadence keeps the team aligned week to week, and it forces small improvements before problems turn into drama.
Think of it as a loop:
measure → review → decide → adjust → measure again.
Weekly or biweekly team meetings and short scorecards
This is the “keep us on the same page” layer. Keep it short. Keep it consistent.
A weekly scorecard can be 6–10 lines, such as:
- output (what moved)
- quality (defects or rework signals)
- customer satisfaction signal (if relevant)
- workload or capacity note
- top blockers
- one decision needed this week
The point is not perfect data. The point is trend and focus.
Rules that stop the meeting from turning into noise:
- review numbers fast, then discuss only what changed
- end with owners and due dates
- log decisions in one place
If your team meetings keep repeating the same problems, you do not have a meeting issue. You have an ownership issue.
Monthly management review (trend-focused, not blame-focused)
Monthly review is where leaders step back and ask, “Is this team getting stronger?”
This is not the place for micromanagement. It is for patterns:
- Is cycle time improving or drifting?
- Is rework rising?
- Are handoffs breaking in the same spot?
- Are engagement or job satisfaction signals moving?
- Are turnover rates starting to creep up?
Bring context into the discussion:
- workload changes
- staffing changes
- new tools or process changes
- external pressure (clients, deadlines, market shifts)
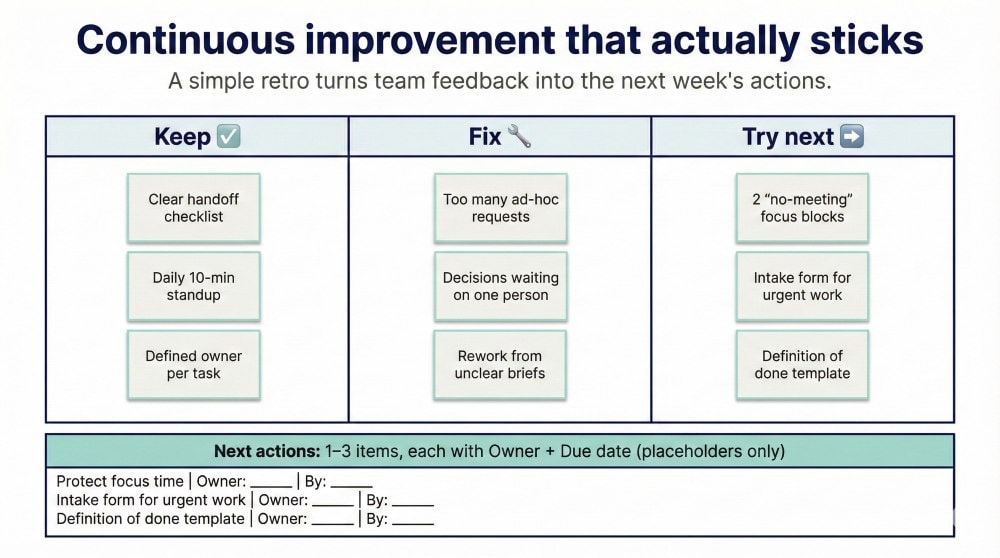
A good monthly review ends with 1–3 clear actions. Not a wish list.

Annual review for strategy, structure, and resourcing
Annual reviews should not be “performance theater.” Use them to fix bigger issues that weekly and monthly reviews cannot solve.
Examples:
- team composition gaps (missing capabilities, duplicated roles)
- team tenure issues (too much churn or stagnation)
- structure problems (unclear ownership across teams)
- training and development priorities
- role clarity updates and career paths
This is also the right time to review whether your measurement system still fits the work. Teams change. Metrics should evolve too.
If you treat the annual review as the only time to reflect, you will spend most of the year flying blind.
Common mistakes when measuring team effectiveness
Most teams do not fail because they lack data. They fail because they collect the wrong data, or they use it in the wrong way.
These are the mistakes that quietly ruin measurement programs.
Metric overload and vanity metrics
If your scorecard has 25 metrics, you have no scorecard. You have a spreadsheet museum.
Too many metrics create three problems:
- people stop paying attention
- leaders cherry-pick numbers that support their story
- teams spend time reporting instead of improving
Vanity metrics look impressive but do not guide action. Examples:
- “number of meetings held”
- “messages sent”
- “hours logged”
- “tasks created”
These measure motion. They do not measure effectiveness.
A better approach is a small set of signals that answer one question: “Are we getting better at delivering results with less friction?”
Confusing individual performance with team effectiveness
Individual performance matters. But it is not the same thing.
A team can have top individual performers and still underperform as a unit. This happens when:
- work depends on handoffs that keep breaking
- decisions take too long
- roles overlap or leave gaps
- one person becomes the default fixer
The opposite also happens. A team can deliver strong outcomes even with average individual performance because the system is solid.
If you only focus on individual output, you can miss the true bottleneck. Then you “fix” the wrong thing. You move people around or push harder, while coordination stays broken.
Use individual data for coaching. Use team metrics to improve the system.

Collecting data without decisions attached
This is the most common failure.
Teams run surveys. Leaders review dashboards. Everyone nods. Nothing changes.
If measurement does not lead to a decision, people stop trusting it. Then engagement drops. Survey honesty drops. The whole system becomes a ritual.
A simple rule: for each review, force one clear output:
- one decision
- one owner
- one due date
Even small changes compound. No changes at all is what kills measurement.
Treating measurement like policing
When measurement feels like surveillance, people optimize for safety:
- they hide problems
- they avoid risk
- they give you “safe” answers
- they game the metrics
That destroys the whole point. You want early truth, not late theater.
Keep measurement framed as improvement. Focus on trends. Ask what the system is producing, not who to blame.
[Image: Team discussion around a chart labeled “trend” with sticky notes labeled “causes” and “fixes.” Alt: “Using measurement for continuous improvement, not blame”]
FAQ: Measuring Team Effectiveness (People Also Ask)
This section answers the questions people actually type into search bars at 2 a.m. while wondering why their team is stuck. Keep it direct. Keep it usable.
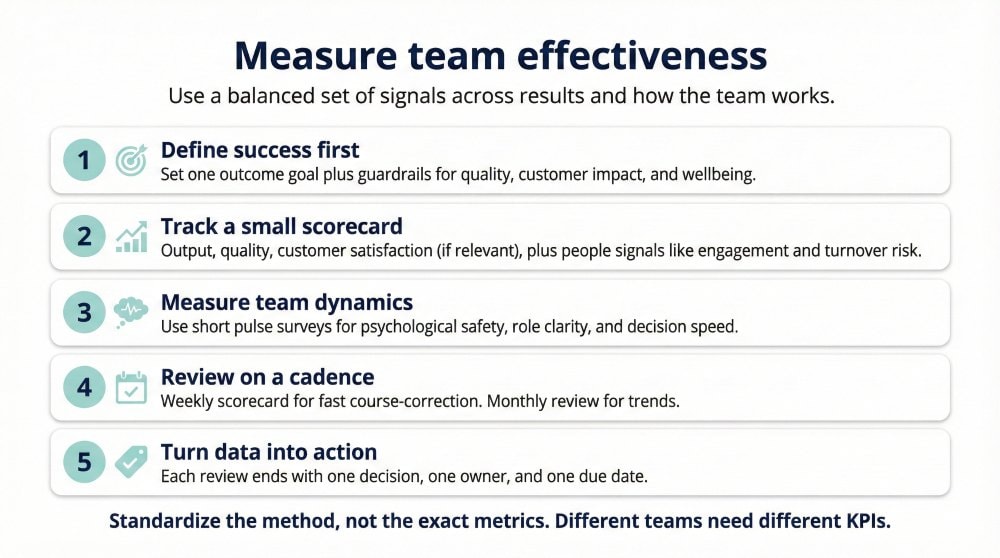
How do you measure team effectiveness?
Measure team effectiveness with a balanced set of signals across results and how the team works.
A practical approach:
- Define success first
Set one outcome goal plus guardrails for quality, customer impact, and wellbeing. - Track a small scorecard
Include output, quality, customer satisfaction (if relevant), and people signals like engagement and turnover risk. - Measure team dynamics
Use short pulse surveys to track psychological safety, role clarity, and decision speed. - Review on a cadence
Use a weekly scorecard for fast course-correction and a monthly review for trends. - Turn data into action
Each review ends with one decision, one owner, and one due date.
If you want measurement to be reliable across teams, standardize the method, not the exact metrics. Different teams need different KPIs.
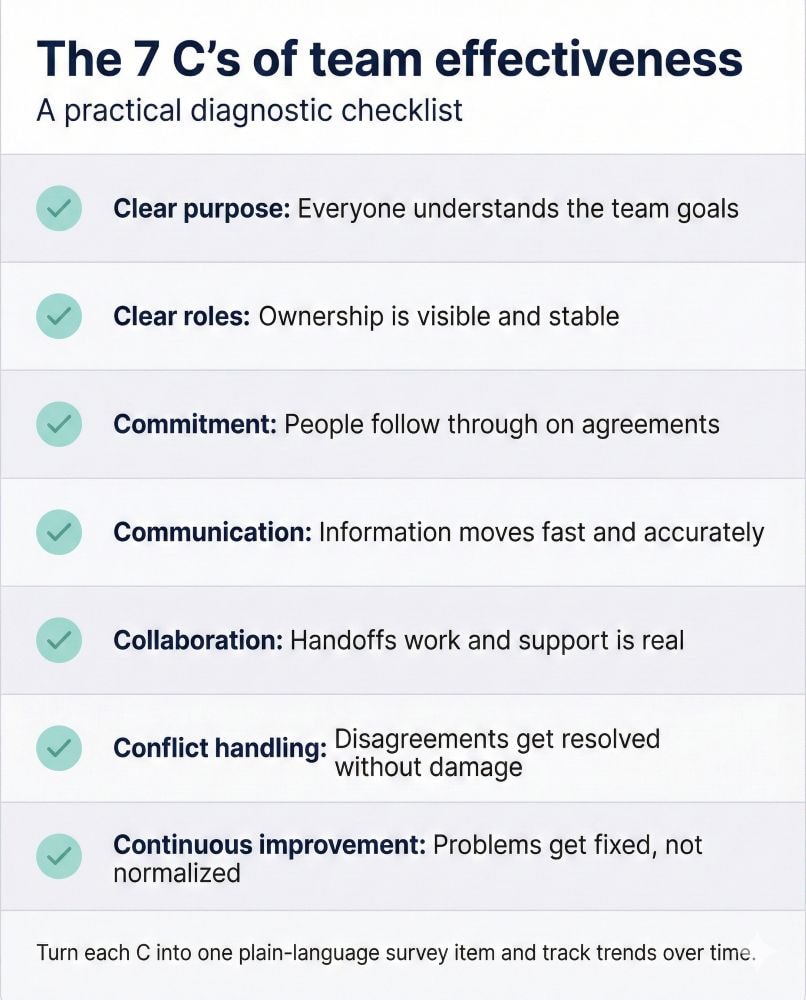
What are the 7 C’s of team effectiveness?
The “7 C’s” is a popular summary framework. Versions vary by source, but the intent is consistent: effective teams share clear direction, strong coordination, and healthy working norms.
A practical way to use the 7 C’s is to treat them as a diagnostic checklist:
- Clear purpose: everyone understands the team goals
- Clear roles: ownership is visible and stable
- Commitment: people follow through on agreements
- Communication: information moves fast and accurately
- Collaboration: handoffs work and support is real, not performative
- Conflict handling: disagreements get resolved without damage
- Continuous improvement: the team fixes problems instead of normalizing them
If you use this in measurement, keep it simple. Turn each “C” into one plain-language survey item, then track trends over time.
What are the 5 factors of team effectiveness?
This question usually means: “What should I focus on first?”
A practical set of five factors that map to real team outcomes:
- Clear goals and priorities
People know what matters this week and this quarter. - Role clarity and ownership
Work has owners. Decisions have owners. Nothing “floats.” - Strong team process
Handoffs, planning, and decision rules reduce delays and rework. - Psychological safety and trust
People raise issues early, admit mistakes, and challenge ideas. - Balanced workload and capability fit
The team has the right mix of skills and is not running on burnout.
If one of these is weak, team performance becomes fragile. You might still get output, but it will cost you quality, speed, or retention.
How often should you measure team effectiveness?
Match the cadence to the type of signal:
- Weekly or biweekly: a short scorecard (output, quality, blockers, key decisions)
- Monthly or quarterly: pulse survey on dynamics (psychological safety, clarity, workload)
- Quarterly or annually: deeper review of team composition, skills gaps, and longer-term outcomes
Avoid measuring everything at the same frequency. Weekly is for steering. Quarterly is for patterns.
What are the best KPIs for team effectiveness?
The best KPIs depend on team type, but most teams benefit from a balanced set:
- Output: throughput, cycle time, on-time delivery
- Quality: rework rate, defects, error rate
- Customer satisfaction: CSAT, complaints, renewal signals (when relevant)
- People: engagement pulse, absenteeism, turnover rates
- Collaboration: decision time, blocker time, meeting load
Pick 1–2 per bucket. Track trends. Drop metrics that no one uses to make decisions.
How do you measure team effectiveness in remote or hybrid teams?
Remote and hybrid work adds two common risks: silent misalignment and slow decisions.
Focus measurement on clarity and flow, not surveillance.
Useful signals:
- decision time and clarity of owners
- handoff delays and blocker time
- meeting load (too many meetings is a common failure mode)
- pulse items on role clarity and psychological safety
- quality drift and rework trends
Also watch for “invisible work.” Remote teams can look quiet while people are overloaded. That shows up in rising cycle time, more rework, and falling engagement.
Conclusion: A simple operating system for continuous improvement
Measuring team effectiveness does not need to be complicated. It needs to be consistent.
If you want a system that works across many teams, use the same loop every time:
- Define success in plain language
Set team goals and add guardrails for quality, customer impact, and wellbeing. - Track a balanced scorecard
Measure output, quality metrics, and the few people and collaboration signals that predict future performance. - Measure team dynamics on purpose
Use short pulses for psychological safety, role clarity, and decision speed. Keep it simple and repeatable. - Review on a cadence that drives action
Weekly scorecards for course correction. Monthly reviews for trends. Annual reviews for structural fixes. - Turn data into decisions
No decision, no value. Each review ends with one owner and one due date.
If you want to see how this looks with your own roles and teams, you can test OAD for free and compare candidates or team members with data instead of gut feel. That makes it easier to improve team dynamics, reduce mismatches, and build effective teams that perform without constant friction.