Most organizations claim they “use data.” Then they hire, promote, and invest based on whoever argues loudest in the meeting.
A data based approach fixes that. It makes decisions using relevant data, clear criteria, and repeatable methods, instead of intuition and subjective elements. In HR, that matters because the cost of a bad hire is not just money. It’s time, team morale, and performance drag.
Table of Contents
- What is a data based approach?
- Why businesses use a data based approach
- The data based decision making process (step-by-step)
- Data collection and data management systems
- Data analysis and data analytics (including big data)
- Business intelligence tools and data visualization
- People and culture: building a data driven organization
- Examples of a data-driven approach in practice
- What is the data based approach to intelligence?
- FAQ: Data based approach questions (People Also Ask)
- Conclusion: how to implement a data based approach this quarter
What is a data based approach?
A data based approach is a way of making decisions where you:
- define what “good” looks like (the outcome and the criteria)
- collect accurate data tied to that outcome
- analyze data to find patterns you can act on
- document the decision making process so it can be repeated and improved
This approach is closely related to making data driven decisions, which rely on collecting, analyzing, and interpreting data to guide strategic choices and minimize bias.
A data based approach means using data to support judgment with evidence, not replace thinking. Data-driven methods typically answer “what” and “when” questions by providing broad, scalable, and automated analysis, while traditional methods often focus on answering “why” through more in-depth studies.
What is meant by “data-based”?
“Data-based” means your conclusion is anchored in observable inputs, not opinions. In practice, that includes:
- quantitative data (rates, time-to-fill, error counts, conversion steps)
- qualitative data you can structure (interview scorecards, calibrated feedback, customer surveys)
- behavioral and performance signals (user behavior, traffic patterns, purchase histories)
The key is relevance. More data is not better. Relevant data is better.
Data based vs data driven decision making
People use these terms interchangeably, but they’re not the same in real life:
- Data based decision making: Data informs the decision. Humans still own the call. The process is explicit and auditable. Strategic decisions are increasingly informed by real time data and analytics, ensuring that key organizational choices are grounded in up-to-date information.
- Data driven decision making: Data strongly drives the decision, often through automated rules, models, or real time analytics.
By 2026, the data-based approach has evolved to leverage AI-enabled autonomous analytics that can predict future scenarios and execute business processes independently. Approximately 65% of organizations are expected to make fully data-driven decisions that leverage factual metrics and real time data.
In HR and talent decisions, “data driven” can go wrong fast if the inputs are biased or low quality. A data based approach is usually the better starting point because it forces clarity: what you measured, why it matters, and what you will do with it.
This is also where structured tools matter. For example, a scientifically validated assessment turns “gut feel” into comparable data points. It gives hiring managers a consistent way to evaluate candidates, instead of relying on unstructured conversations that vary by interviewer.
Why businesses use a data based approach
A data based approach is not “nice to have.” It’s how you make better business decisions when the cost of being wrong is high. In HR, that cost shows up fast: bad hires, avoidable turnover, slow teams, and wasted manager time.
Leveraging data-driven insights enables organizations to identify new business opportunities and remain competitive in dynamic markets by adapting strategies, products, and pricing to meet evolving demands. Integrating a data-driven business strategy is essential for guiding decision-making, operational optimization, and aligning data initiatives with overall business objectives.

By adopting a data based approach, companies can:
- Respond quickly to market changes
- Optimize resource allocation
- Improve employee engagement
- Drive innovation
Incorporating a data-driven strategy is critical in today’s business landscape, as it empowers companies to turn vast amounts of information into strategic insights.
Informed decisions with less bias
A data based approach lowers noise in the decision making process. It does that by forcing three disciplines:
1) Clear criteriaDefine what “good” means before you decide. If the criteria are vague, the decision will be vague.
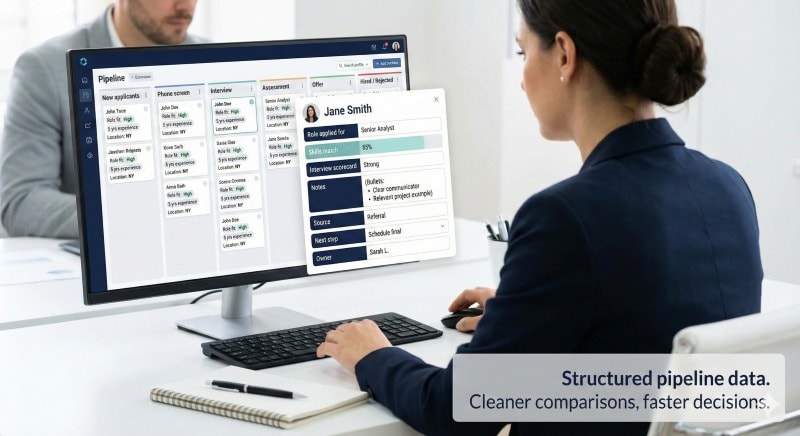
2) Comparable inputsUse the same yardstick for everyone. Structured data helps. Free-form opinions do not. Using structured data allows organizations to draw conclusions based on evidence rather than opinion. Structured data also helps inform business decisions by providing objective, comparable inputs.
3) AccountabilityWrite down what you decided and why. Later, compare the outcome to the decision. That is how you improve the process.
This matters in hiring. Unstructured interviews create inconsistent results. Two hiring managers can meet the same person and reach opposite conclusions. A data based approach reduces that risk. It uses shared criteria, scorecards, and consistent evaluation.

Business objectives: growth, cost savings, and competitiveness
Companies use a data driven strategy because it supports real outcomes:
- Growth: find what works and scale it
- Cost savings: decrease expenses by cutting rework and bad bets
- Speed: spot problems earlier and act faster
- Consistency: reduce decisions based on subjective elements
- Competitiveness: respond to market trends with evidence
Analyzing data reveals patterns and causes, which supports strategic business decisions. Data-driven strategies help organizations identify new opportunities and optimize operations, enabling them to adapt and thrive in changing markets.
A simple HR example: turnover feels “random” until you analyze data. When you look at role, manager, time-to-productivity, and performance, patterns appear. Then you can act on causes, not guesses.

Structured assessments make candidate fit measurable. That gives you cleaner inputs and more reliable insights than gut feel alone.
The data based decision making process (step-by-step)
A data based approach only works if the process is clear. Most teams fail here. They collect data, build dashboards, then still decide by instinct. The fix is simple: define the decision first, then collect and analyze data that actually supports it.
Data-driven insights, derived from analyzing large, real-time datasets using technology, help inform decisions and minimize subjective bias and guesswork. This enables organizations to make more confident, accurate, and strategic choices.
1) Define the business challenge and the decision
Start with a single sentence:
- What decision are you making?
- Who will make it?
- By when?
- What does success look like?
Keep it tight. If the goal is fuzzy, your data will be fuzzy.
Example (HR): “We need to hire two account managers who ramp fast and retain for 12+ months.”
That single line sets the direction for everything that follows.
2) Set decision criteria and success metrics
Decide how you will judge “good” before you look at candidates, vendors, or options.
Use a small set of criteria that match the job or business objectives. For HR decisions, that often includes:
- performance outcomes (quality, productivity, quota, error rate)
- ramp time (time-to-productivity)
- retention or tenure
- manager workload and team impact
- candidate experience signals (drop-off, acceptance rate)
Analyzing data helps identify trends that inform which success metrics and decision criteria are most relevant for your objectives.
Make the criteria visible to everyone involved. This reduces subjective elements later.

3) Collect relevant data from multiple data sources
Now collect data that matches the criteria. Not every data point matters. Focus on relevant data, not “available data.” Leveraging data from multiple sources enables organizations to make more informed and effective decisions by providing a comprehensive view and actionable insights.
Common sources include:
- enterprise data (HRIS, ATS, CRM, performance data)
- interview scorecards and structured feedback
- customer surveys or internal engagement surveys
- analytics tools (web, product, campaign performance)
- market trends and benchmarks (used carefully)
If a source is messy, label it as messy. Pretending it’s clean is how teams fool themselves.
4) Perform data analysis and interpret the results
This is where many organizations get stuck. They either overcomplicate it or oversimplify it.
A practical approach:
- look for patterns (what shows up often?)
- check the basics (sample size, missing data, timing)
- compare groups (top performers vs average, retained vs churned)
- test assumptions (is this signal stable or a one-off?)
Interpreting data is crucial for extracting meaningful insights that guide decision-making and help organizations act on their findings. Data science techniques can be used to perform advanced analysis and uncover deeper insights from complex datasets.
Avoid false precision. If you cannot support a precise number, keep it directional.
Also watch for the classic trap: confusing correlation with cause. Data can show what moves together. It does not always explain why.

5) Make the decision and document it
Decide, then write down:
- what you chose
- what data supported it
- what you assumed
- what you will measure next
This turns the decision into a repeatable system. It also makes reviews easier later.
A simple “decision log” is enough. Most teams do not need a new platform. They need discipline.
6) Track outcomes and improve the process
After the decision, measure the result against your criteria:
- Did performance improve?
- Did ramp time drop?
- Did turnover change?
- Did candidate quality improve?
- Did the process get faster or slower?
Then adjust. This is how a data driven organization gets better over time. It learns from reality, not from meetings.
This process works best when your inputs are structured. In HR, assessments and structured interviews can make candidate evaluation more consistent, which improves data quality and downstream decisions.
Data collection and data management systems
A data based approach breaks when data is missing, messy, or trapped in silos. Collecting data is not the hard part. Collecting the right data, consistently, and in a way people can trust is the hard part.
Raw data vs relevant data
Raw data is everything you can capture. Logs, clicks, notes, timestamps, comments, spreadsheet chaos.
Relevant data is what helps answer the decision in front of you.
Relevance depends on the question.
- If the question is hiring quality, “time spent on the careers page” is not the first metric to chase.
- If the question is retention, “offer acceptance rate” is not enough by itself.
Start from the decision criteria, then work backward to the data you need.
A useful rule: if a data point does not change the decision, it’s noise.
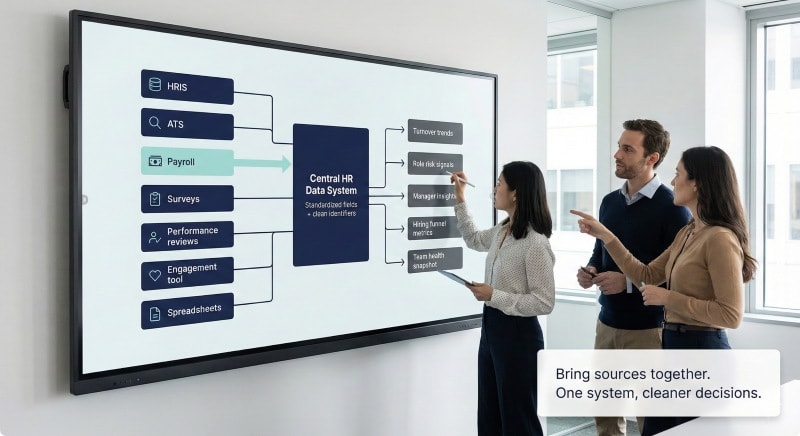
Where organizations collect data from
Most companies already have plenty of data sources. The problem is that they are scattered, inconsistent, and owned by different teams.
Common sources include:
- Enterprise data: HRIS, ATS, payroll, performance systems, learning systems
- Customer and market inputs: customer surveys, market trends, competitor benchmarks
- Digital signals: user behavior, traffic patterns, campaign analytics tools
- Commercial signals: purchase histories, conversion rates, pipeline velocity
- People signals: structured interview scorecards, calibrated performance ratings
If you rely on free-text notes as a core input, you are choosing low-quality data. That is fine for context. It is weak for comparison.
Data management systems: store, process, and access
A data management system is not one tool. It’s the set of systems that store data, move it, and make it usable.
At a basic level, you need:
- a consistent place where the “source of truth” lives
- defined fields (so teams record the same thing the same way)
- access controls (so the right people can use the data)
- a way to connect systems (so you can analyze data across sources)
Without this, reporting becomes a manual hobby. Then it dies.
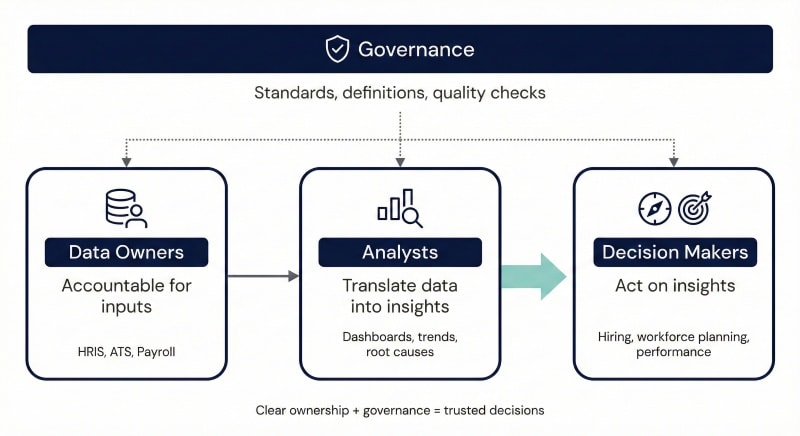
Data governance: data quality and decision trust
Data governance sounds boring because it is. It’s also what stops the entire organization from arguing about whose spreadsheet is correct.
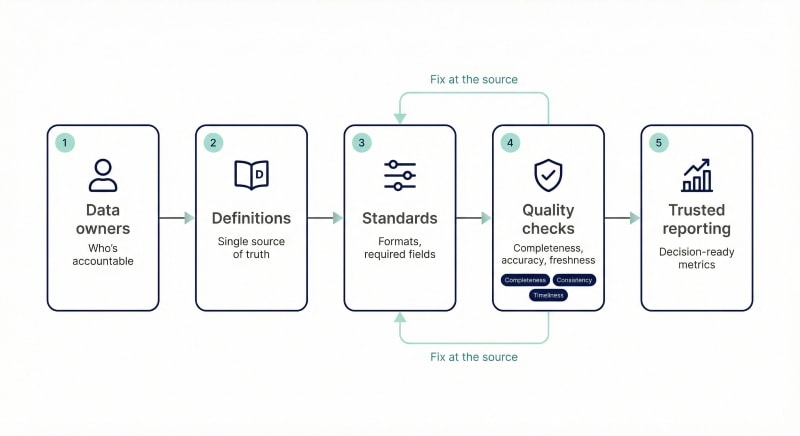
Good data governance covers:
- Ownership: who is responsible for each data set
- Definitions: what each metric means (and what it does not mean)
- Quality checks: missing values, duplicates, outdated fields
- Change control: what happens when a metric definition changes
Data quality is not perfection. It is reliability. The goal is that decision makers trust the numbers enough to act.
Data privacy regulations: global baseline with US reality
If you collect people data, you need privacy discipline. The global baseline is basically:
- collect what you need
- explain why you collect it
- store it securely
- restrict access
- keep it only as long as necessary
For many global companies, GDPR sets the strictest standard, so it’s the safest default. In the US, privacy expectations vary by state, but the practical direction is the same: transparency, minimization, and control.
If your data strategy ignores privacy, it will eventually be corrected by lawyers, regulators, or reputational damage. Pick the least painful option.
Structured assessments can improve data quality by turning vague impressions into consistent inputs. That makes governance easier and reduces “he said, she said” hiring debates.
Data analysis and data analytics (including big data)
Collecting data does not make you smart. It just makes you a collector. The value comes when you analyze data in a way that supports real decisions.
Data processing is crucial for transforming raw data into actionable insights. Big data processing frameworks support both batch and stream processing, enabling organizations to handle large-scale analytics efficiently.
Descriptive, diagnostic, and predictive analysis
Most business decisions use three types of analysis. You do not need a PhD. You need to pick the right tool for the question.
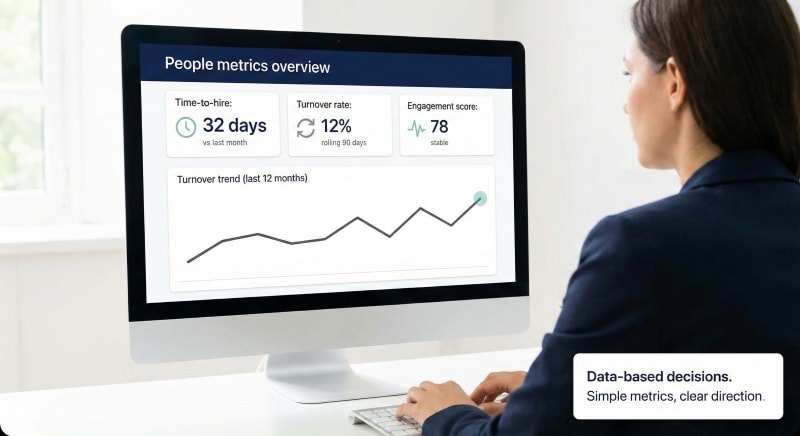
Descriptive analysis: What happened?
This is reporting. Counts, averages, rates, trends over time.
Example: “Turnover rose from Q2 to Q3.” Or “Time-to-fill increased.”
Diagnostic analysis: Why did it happen?
This looks for drivers and differences between groups.
Example: “Turnover is concentrated in two roles and three managers.”
Or “Candidates drop off after the second interview.”
Predictive analysis: What is likely to happen next?
This estimates future outcomes based on patterns in historical data.
Example: “Candidates with X profile ramp faster.”
Or “This pipeline mix will miss hiring targets.”
Predictive analysis can be helpful, but only if the inputs are stable and the model is tested. Otherwise, it’s just confidence with nicer charts.
Big data and real time analytics: when they help
“Big data” is useful when volume, variety, or speed actually change the decision. Many organizations chase it because it sounds modern.
Use big data or real time analytics when:
- decisions need fast signals (fraud detection, inventory shifts, incident response)
- you have enough data points to reduce randomness
- patterns are too complex for manual review
Avoid it when:
- the decision is low-frequency (executive hiring, strategic restructuring)
- the data is low quality or inconsistent
- the main issue is unclear criteria, not lack of data
In HR, more data is not always better. If your interview process is unstructured, adding more data sources won’t fix the core problem. It will just give you more ways to be wrong.
Avoiding false certainty and bad conclusions
Data analysis fails in predictable ways. If you want a data driven organization, you need guardrails.
Common traps:
- Correlation errors: two things move together, but one does not cause the other
- Small samples: a few hires or a single quarter can mislead you
- Survivorship bias: you only study who stayed, not who left
- Bad definitions: “quality” means different things across teams
- Lagging metrics only: you measure outcomes too late to act
A practical fix: treat analysis as decision support, not a verdict. Write down assumptions. Track outcomes. Update your approach when reality disagrees.
Predictive analysis in hiring improves when candidate inputs are consistent. Structured evaluations and validated assessments can reduce noise, which makes insights more reliable and less dependent on subjective elements.
Business intelligence tools and data visualization
If data is the raw material, business intelligence is the factory, and visualization is the packaging. Most companies mess up the last part. They show more charts, not more clarity.
Turning complex datasets into meaningful insights
Business intelligence (BI) tools help you pull data from multiple sources, standardize it, and make it usable for decision makers. The goal is not “more reporting.” The goal is faster, cleaner answers to real questions.
A BI workflow usually includes:
- connecting data sources (ATS, HRIS, CRM, finance, analytics tools)
- cleaning and joining data sets (so fields match and definitions stay consistent)
- creating metrics that map to business objectives
- distributing reports or dashboards to the people who act on them
This is where data governance matters again. If your “time-to-fill” metric differs across teams, your dashboard becomes a debate club.
Dashboards for decision makers, not vanity reporting
A useful dashboard answers a short list of decisions. A useless dashboard shows everything you can measure.
Design rules that keep dashboards readable:
- Start with the decision. What action should the viewer take?
- Use fewer metrics. Three to six is often enough per audience.
- Show trends, not snapshots. One number without context creates bad reactions.
- Make comparisons easy. Role vs role, team vs team, this quarter vs last.
- Label what matters. Definitions, time period, data source.
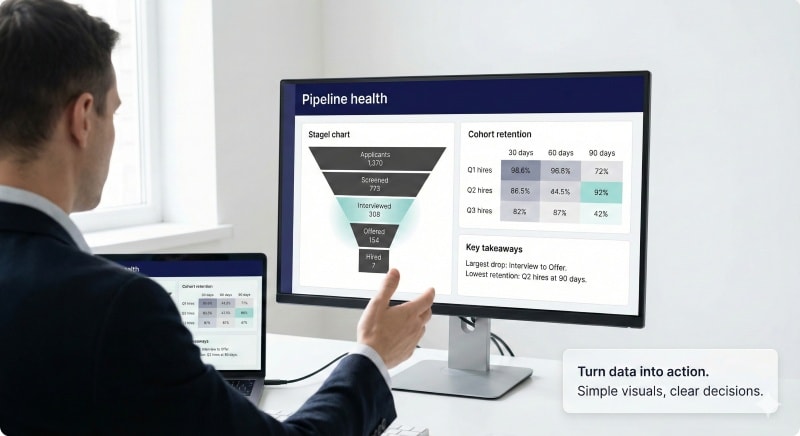
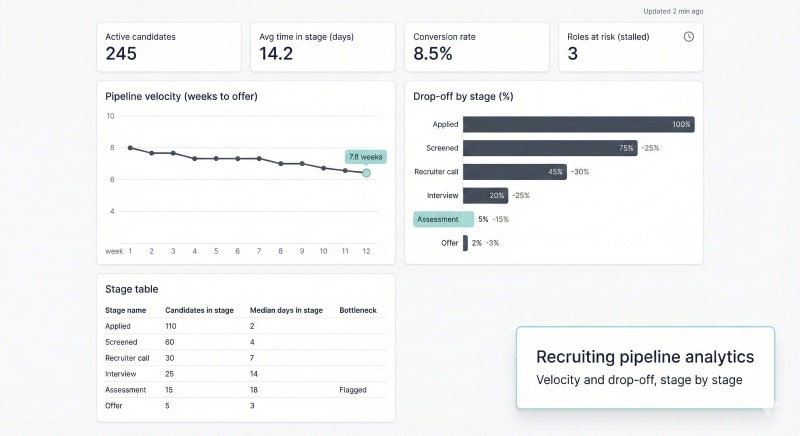
For HR and recruiting, dashboards that tend to drive action include:
- pipeline health (volume, conversion by stage, drop-off points)
- time-to-fill and time-to-productivity
- quality signals (performance outcomes, retention at 6/12 months)
- candidate experience signals (speed, stage friction, acceptance rate)
Avoid “dashboard theater.” If nobody changes behavior after viewing it, it’s decoration.
Dashboards get more useful when inputs are structured. In hiring, consistent scorecards and validated assessments make candidate comparisons clearer, which improves reporting and decision trust.
People and culture: building a data driven organization
Tools do not create a data driven culture. People do. If leaders treat data as optional, everyone else will too. If leaders use data as a weapon, teams will hide problems instead of fixing them.
A functional data driven organization has clear roles, clear ownership, and simple habits that make good decisions repeatable.
Data analysts, data scientists, and business leaders
These roles get mixed up constantly, then everyone wonders why nothing ships.
Data analystsTurn data into usable answers. They build reports, dashboards, and recurring insights. They help teams analyze data without overcomplicating it.
Data scientistsWork on more complex problems: predictive analysis, experimentation, machine learning, and models that need testing. They are not there to fix broken spreadsheets.
Business leaders and decision makersOwn the decision. Data supports the call, but leadership owns trade-offs. If leaders offload decisions to “the data team,” you get slow execution and zero accountability.
In a data based approach, several other key roles are essential for a successful data-driven organization. Data engineers design, build, and maintain the infrastructure and systems required for data collection, storage, and processing. Data architects are responsible for designing and implementing the organization’s overall data architecture. Business intelligence (BI) developers create and manage BI solutions, such as dashboards and reporting systems. Machine learning engineers build, deploy, and maintain machine learning models. Chief data officers (CDOs) oversee the organization’s data strategy and governance. Database administrators (DBAs) manage and maintain database systems, ensuring data is stored securely and retrievable efficiently. Data privacy officers ensure that data handling practices comply with privacy laws and regulations. AI/ML operations (MLOps) engineers manage the deployment, monitoring, and maintenance of machine learning models in production environments.
With the growing importance of artificial intelligence, organizations are also introducing roles like Chief Artificial Intelligence Officer (CAIO). The CAIO plays a strategic role in guiding AI adoption, development, and implementation, ensuring that artificial intelligence initiatives align with business goals and deliver value.
A clean rule: analysts and scientists support decisions. Leaders make them.
Chief data officer and data initiatives
A chief data officer (CDO) can help when an organization is large enough to need coordination across systems and functions. The CDO’s job is not to “run analytics.” It’s to make data usable and trustworthy across the business.
Common CDO responsibilities:
- set standards for data governance and data quality
- reduce duplicated metrics and conflicting definitions
- improve access to enterprise data while protecting sensitive data
- guide data management systems and priorities
- push adoption by making the work easier for teams
What a CDO should not do: become the bottleneck for every report request. If all insights depend on one team, the organization is not data driven. It’s data dependent.
Training programs and a data driven culture
Culture shows up in small behaviors, not slogans. The most effective training programs focus on simple operating rules:
- Use shared definitions. One metric, one meaning.
- Use structured inputs. Scorecards beat opinions in paragraphs.
- Keep a decision log. Record what you chose, why, and what you expect to see.
- Review outcomes. If the result misses, adjust the process.
- Reward learning, not spin. If teams fear bad news, they will hide it.
In HR, this is where consistency matters most. When hiring managers use different standards, data becomes hard to compare. When standards are shared, insights get sharper and decisions get easier.
Structured evaluations and validated assessments help teams use consistent inputs. That improves data quality and reduces the “everyone has a different opinion” problem that kills decision discipline.
Examples of a data-driven approach in practice
Examples matter because “use data” is vague. The real change is this: you stop guessing, and you start testing.
Example: targeted marketing campaigns based on customer preferences
Marketing is a clean use case because results show up quickly.
A data based workflow looks like this:
- Set the goal: more qualified leads, higher conversion, or lower churn
- Collect data: campaign results, customer surveys, user behavior, purchase histories
- Analyze data: which audience segments convert, where people drop off, which message works
- Take action: shift budget, adjust targeting, update messaging, run a test
- Track results: conversion rates, repeat purchases, customer loyalty
The point is not “more dashboards.” The point is better choices. Customer preferences become signals you can measure, compare, and improve.
Example: operational decisions to decrease expenses and improve efficiency
Operations is often where cost savings appear fastest. The feedback loop is short.
A simple example:
- Decision: reduce delivery delays without raising cost
- Relevant data: traffic patterns, staffing levels, order volume, processing time, error rates
- Analysis: find the bottleneck, compare best shifts to worst shifts
- Action: change staffing, fix handoffs, remove rework
- Measure: delays drop, errors drop, costs drop
This works because the data points connect to the business challenge. It is not abstract reporting. It is decision support.
Hiring works the same way. If candidate evaluation is structured, you can link inputs to outcomes like ramp time, performance, and retention. That beats gut feel every time.
What is the data based approach to intelligence?
In business, “intelligence” is not spying. It’s decision support. It’s the step between raw data and action, where you turn signals into a clear point of view.
[Image: Leadership briefing slide with three insights and one recommended action. Alt: “Data based approach turning data sources into business intelligence”]
Intelligence vs reporting
Reporting tells you what happened.
Intelligence tells you what it means and what to do next.
A report might say: “Offer acceptance rate dropped 8% last quarter.”
An intelligence view adds: “The drop is concentrated in one region, after comp changes. If we do nothing, time-to-fill will rise.”
Intelligence connects data to decisions. It filters noise. It also makes assumptions visible, so leaders can challenge them.
Using data sources to inform strategic planning
A data based approach to intelligence follows a simple loop:
- Start with strategic questions
What markets should we enter? Which roles are hardest to fill? Where are we losing margin? What is blocking growth? - Pull from multiple data sources
Enterprise data, customer surveys, analytics tools, market trends, competitive benchmarks. - Analyze data with context
Look for patterns, compare segments, test alternative explanations. If you cannot support a precise number, keep it directional. - Translate into options and trade-offs
Intelligence is not one answer. It’s usually two to three options, with risks and likely outcomes. - Recommend next actions
Clear action beats a “findings” deck. Always tie insights to the decision making process.
This is where many organizations get stuck. They generate insights, but nobody acts. The fix is to make “actionability” a rule: if an insight does not change a decision, it’s not intelligence.
In talent decisions, intelligence improves when candidate data is consistent. Structured evaluation and validated assessments create cleaner inputs, which makes planning and workforce decisions more reliable.
FAQ: Data based approach questions (People Also Ask)
This section is designed to match common search questions. Answers are short on purpose. Busy decision makers do not need a novella.
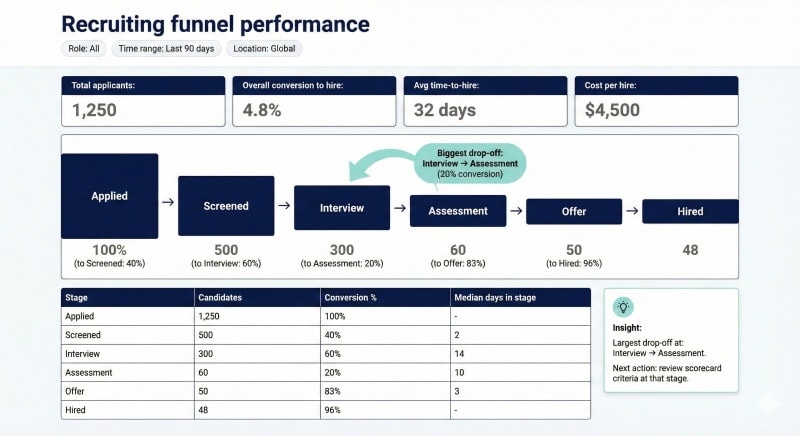
What is an example of a data-driven approach?
A simple example is improving a hiring funnel using stage data.
You track:
- where candidates drop off
- how long each stage takes
- which sources produce qualified candidates
- which interviewers consistently rate harshly or leniently
Then you change one thing, measure results, and repeat. That is data driven decision making: a feedback loop tied to outcomes.
What is meant by data-based?
“Data-based” means decisions are anchored in observable evidence. The evidence can be numbers or structured qualitative inputs. The key is that it’s consistent and comparable.
It does not mean “the spreadsheet decides.” It means data supports judgment.
What is the data based approach to intelligence?
It means turning data sources into decision support. Instead of listing metrics, you translate patterns into:
- what is happening
- why it may be happening
- what options leaders have next
Intelligence is reporting plus interpretation plus a recommendation.
How do you ensure high quality data and governance?
Use a few basics that most organizations skip:
- define key metrics once (one meaning, one owner)
- use structured fields where possible, not free-text notes
- run simple quality checks (missing values, duplicates, outdated entries)
- control access and protect sensitive data
- document changes to definitions over time
High quality data is data people trust enough to act on. If teams argue about the numbers, governance is not working.
Conclusion: how to implement a data based approach this quarter
A data based approach does not require a massive rebuild. It requires clarity, a few shared rules, and the discipline to measure outcomes. If you try to “be data driven” everywhere at once, you’ll stall. Start with one decision stream that matters.

A simple 30-day rollout plan
Days 1–7: Pick one high-impact decision and define success
Choose a decision that repeats often and affects business outcomes. Hiring, promotion, workforce planning, pipeline conversion, or retention are common.
Write down:
- the decision
- owner and timeline
- 3–5 decision criteria
- what success looks like
Days 8–14: Standardize inputs and clean the minimum data set
Do not chase perfection. Define the minimum set of data points you need.
- align definitions (what each metric means)
- reduce free-text where possible
- ensure data sources are consistent
- label known gaps instead of hiding them
Days 15–21: Run the process and document decisions
Perform data analysis that matches the decision. Keep it simple.
- descriptive first, diagnostic next
- predictive only if you have stable inputs
- write down assumptions and trade-offs
- record decisions in a short decision log
Days 22–30: Review outcomes and tighten the loop
Compare outcomes to the criteria you set.
- what improved?
- what surprised you?
- what data was missing?
- what should be changed in the process?
This is how a data driven culture becomes real: decisions get better because the organization learns.
If you want to see how this works in talent decisions, you can test OAD for free. Use it on your real roles and candidates, then compare results against outcomes like performance, ramp time, and retention. That’s how you replace gut feel with structured, decision-ready data.